Figure 3.
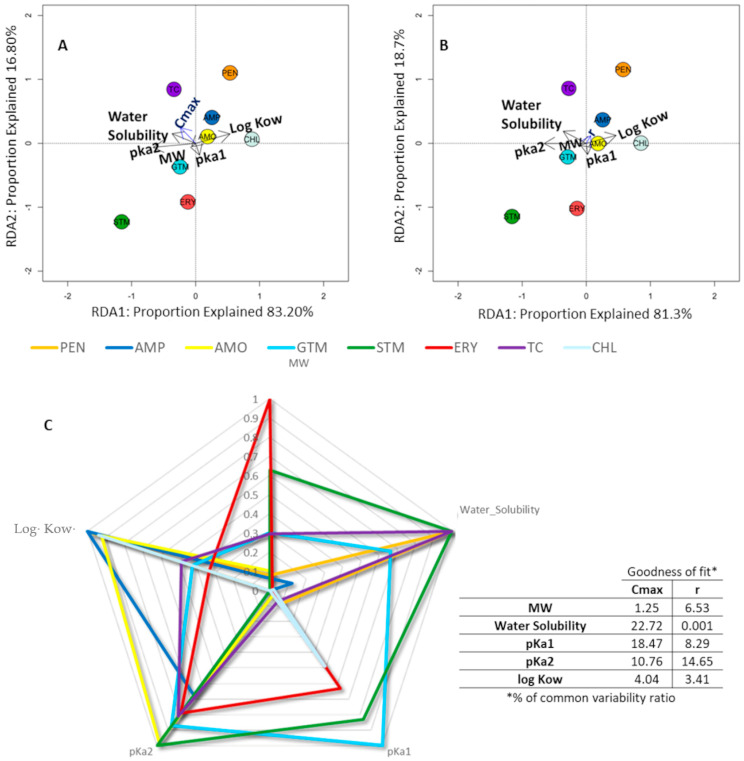
Radial graph. Redundancy analysis and physicochemical parameters representation. (A,B): redundancy analysis showing the relationship between the antibiotic and physicochemical parameters; antibiotic physicochemical properties were considered as exploratory variables and Cmax (A) and r (B) at 1000 µg/mL of antibiotic as response variables. Arrow length indicates the variance that can be explained by each parameter, with the perpendicular distance of the antibiotic to the arrow indicate the parameter’s relative importance. The groups marked in graph A are significant (p < 0.05). (C) shows the radial chart that explores each one of the studied physiochemical parameters as a dimension, with % of common variability ratio for each of the parameters.

