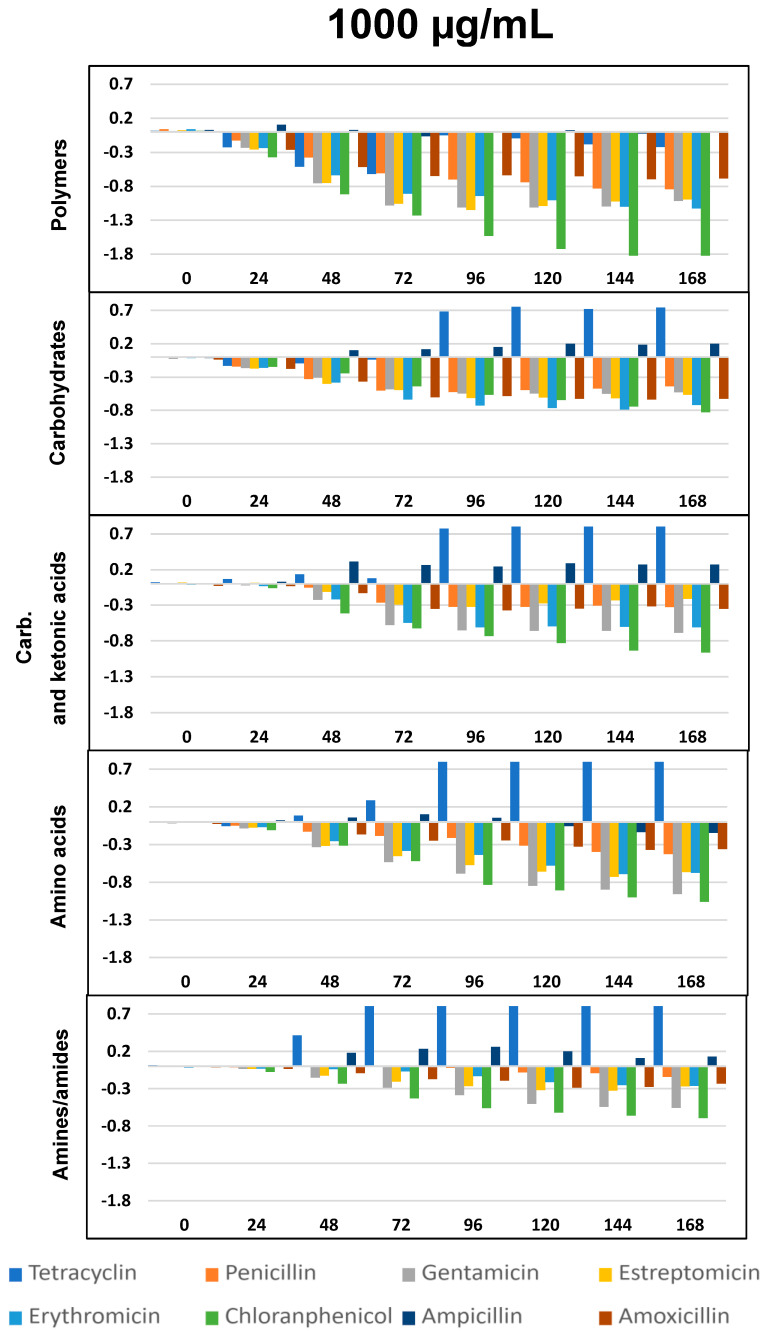
Figure 6.
∆OD vs. time (h) curves for the eight antibiotics and five selected groups of metabolites, as in Figure 4, but at the concentration of 1000 µg/mL. All differences with respect to the control show p < 0.05, except ampicillin for polymers and amino acids.

