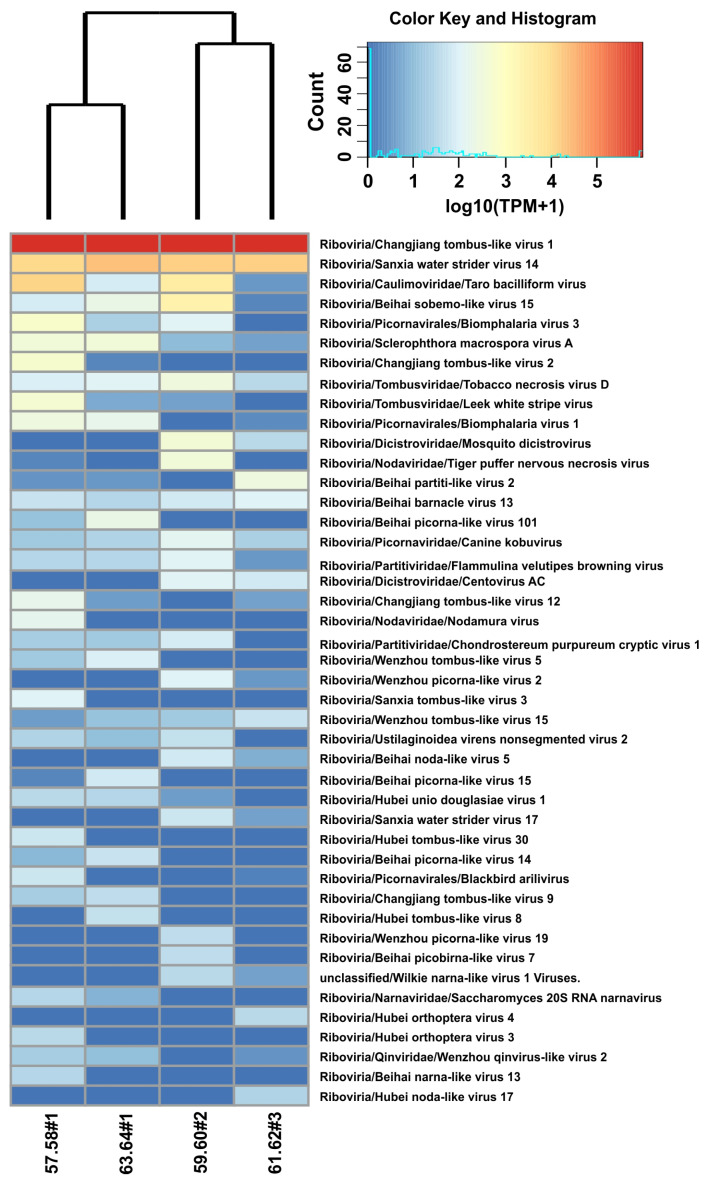
Figure 3.
Heat map demonstrating the diversity of virotypes and their representation in the samples of the B. baicalensis. Heat map cells show normalized TPM (transcripts per million) values of the representation of virotypes in different mollusk samples. For convenience, TPM values have been converted to a decimal logarithm scale (log10(TPM + 1)). The color key contains a histogram of the occurrence of cells on the map with the corresponding log10(TPM + 1) values.

