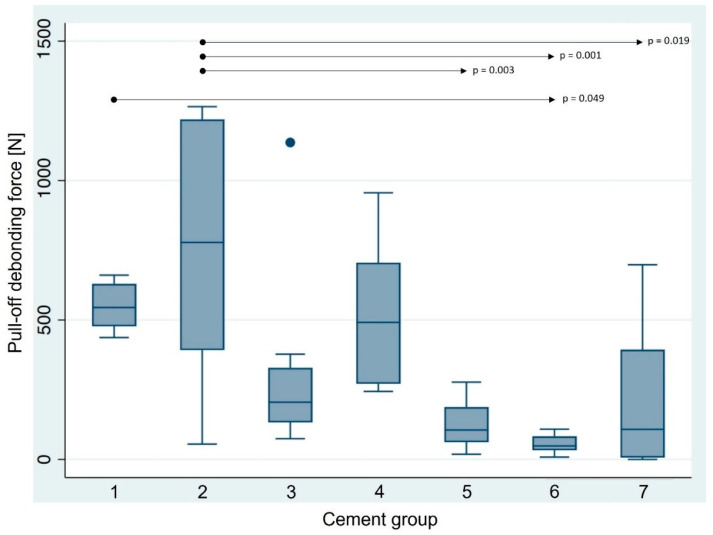
Figure 6.
The boxplot diagram represents the bond strength values of the experimental groups (N = 55). Horizontal black lines indicate statistically significant differences among the seven groups. Group 1: SpeedCEM Plus; group 2: Panavia SA Cement Universal; group 3: Panavia V5; group 4: RelyX Unicem 2 Automix; group 5: VITA ADIVA IA-Cem; group 6: Ketac CEM; group 7: Hoffmann’s Phosphate Cement.

