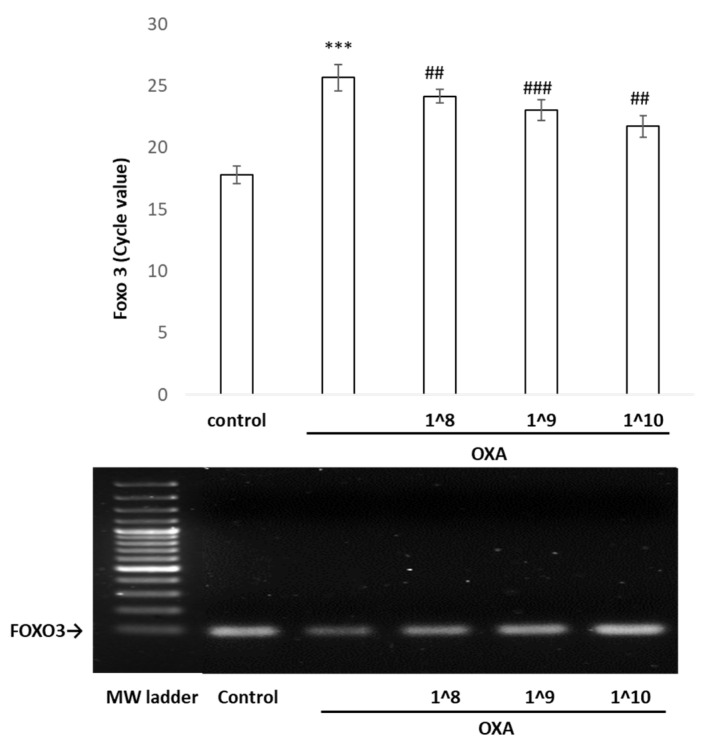
Figure 7.
ChIP-qPCR analysis to analyze the binding ability of p53 to FOXO3 promoter. Upper panel was qPCR performed using the FOXO3 forward and reverse primer set. Data are represented as mean ± standard deviation for three independent replicates. In the lower panel, there is a representation of the PCR amplification of the FOXO3 promoter that was bound by p53. This provides more detailed insight into the increasing binding affinities of p53 to the FOXO3 promoter with higher concentrations of EV treatment. *** p < 0.001 compared with the untreated control, and ## p < 0.01 and ### p < 0.001 compared with oxazolone.

