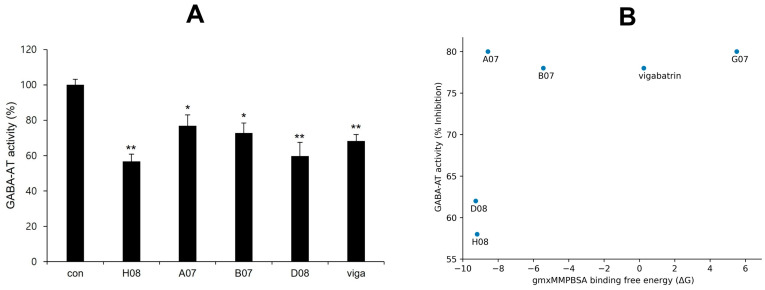
Figure 10.
(A) GABA-AT inhibitory activity of screened compounds in comparison to vigabatrin. The concentration of vigabatrin and the screened compounds (H08, A07, B07, and D08) was 25 μM (single (*) and double (**) marks represent statistical significance at p < 0.05 and p < 0.01, respectively). (B) Scatterplot between GABA-AT inhibitory activity and gmx_MMPBSA binding free energy (ΔG).

