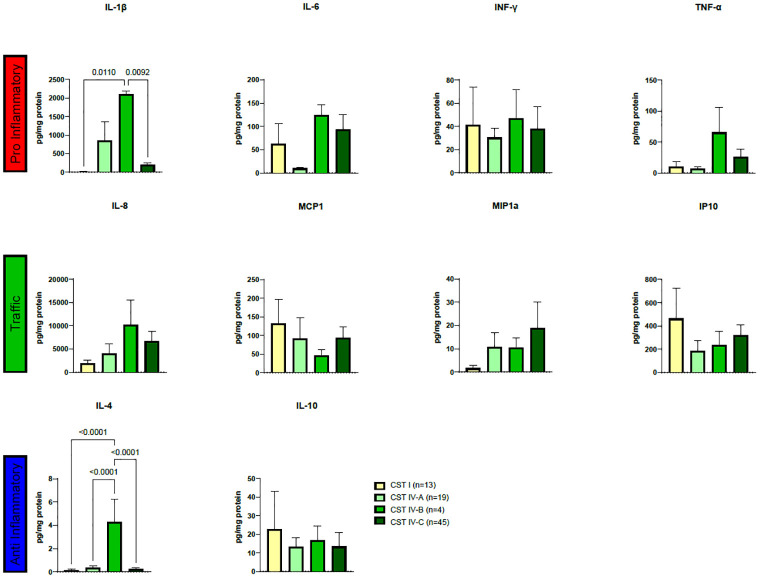
Fig 2. Cytokine profiles evaluated through LUMINEX, plotted according to CST classification.
Cytokine concentrations (pg/mg protein) were used to compute multiple comparison analyses using ordinary one-way ANOVA with Tukey’s multiple comparisons tests. Results are depicted in boxplots for cervical disease, and brackets and corresponding p-values highlight significant differences.

