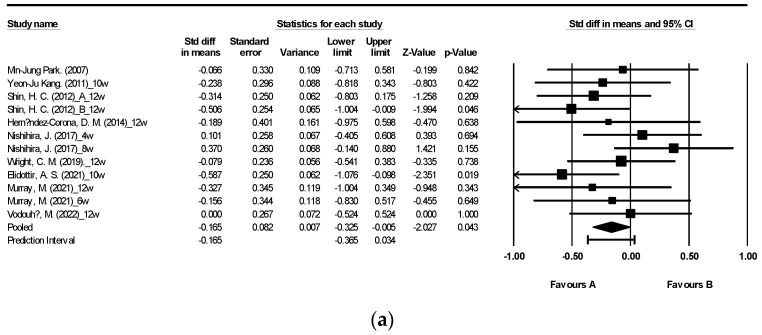
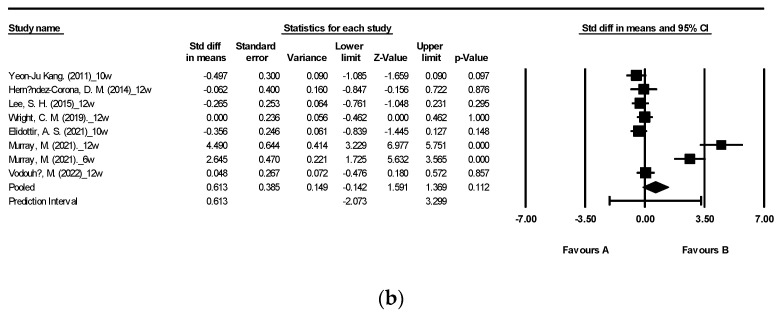
Figure 2.
Forest plot of the effect of brown seaweeds or their extracts on fasting blood glucose (a) and fasting blood insulin (b) [27,29,30,31,34,40,42,43,47,48]. Each black square signifies a study’s point estimate and indicates its sample size—larger squares represent studies with more participants. The diamond shape represents the pooled mean difference.


