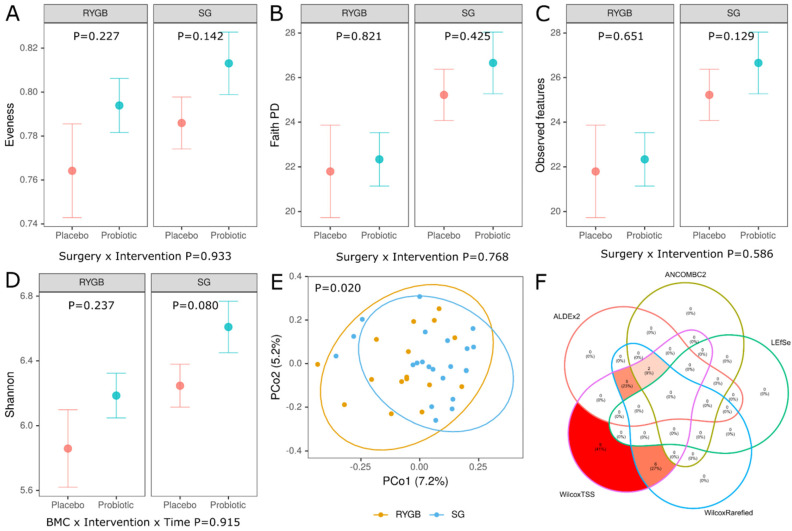
Figure 5.
Alpha-diversity, beta-diversity and differential abundance analysis at baseline. Alpha-diversity (A–D), beta-diversity using Bray–Curtis distance (E) and Venn diagram (F). Below plots in (A–D), p values are obtained from a general mixed-effects model for the two-way interaction, i.e., type of surgery (RYGB versus SG) by intervention (Placebo versus Probiotic) while p values in each facet refer to Placebo versus Probiotic comparison in the RYGB and SG group; (E)—Principal-coordinate analysis (PCoA) ordination plot based on Bray–Curtis distance metrics demonstrating significant grouping of samples (PERMANOVA F = 1.27, p = 0.020 RYGB versus SG); (F)—Venn diagram comparing 5 methods of differential abundance analysis at the genus level (10% prevalence filtered) (ALDEx2, ANCOMBC2, WilcoxTSS, WilcoxRarefied and LEfSe) [51,52,53], WilcoxTSS and WilcoxRarefied use Wilcoxon test on relative abundance data (TSS, total sum scaling) or rarefied data (sampling depth = 14,193), RYGB—Roux-en-Y Gastric Bypass, SG—Sleeve Gastrectomy.

