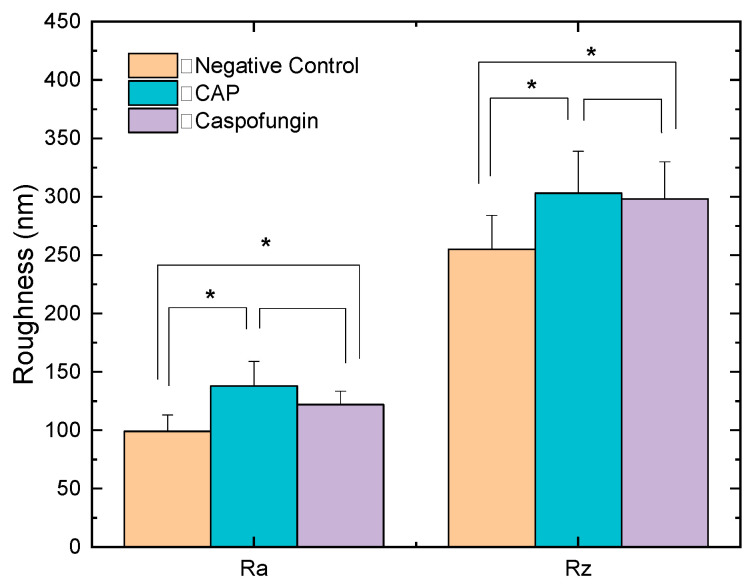
Figure 2.
Mean and standard deviation of roughness parameters measurements (arithmetic average, Ra, and peak-to-valley height, Rz) of cells exposed to cold atmospheric plasma (CAP) and caspofungin (positive control) in relation to control (negative control). * p < 0.05 (ANOVA and Tukey’s post hoc test).

