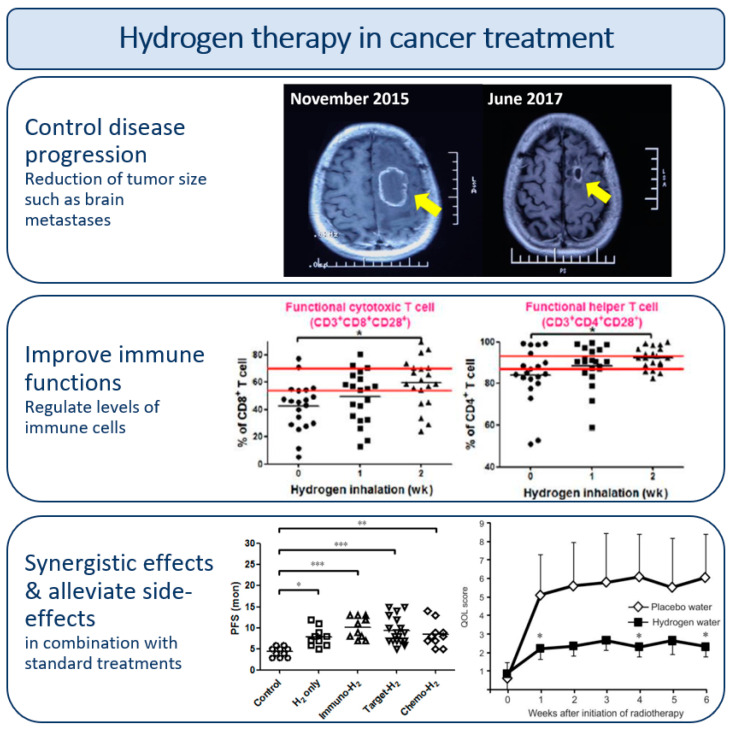
Figure 3.
Schematic overview of the effects of hydrogen therapy in cancer treatment. The top images show MR imaging of brain metastasis (arrow) before (left) and after (right) H2 treatment, adapted from [24]; OncoTargets and Therapy 2019:12 11145-11151—originally published by, adapted and used with permission from Dove Medical Press Ltd., Macclesfield, UK. The middle figures show alterations in cytotoxic and helper T cell levels in cancer patients after H2 treatment, adapted from [31]. The parallel red lines show the normal range of cell levels and the black short lines show the measured average values at each time point. The bottom left figure shows number of months (mon) with progression-free survival (PFS) of lung cancer patients receiving no treatment (control), H2 therapy (H2 only), or combined treatments with H2 and immunotherapy (immuno), targeted therapy (target) or chemotherapy (chemo). The black short lines show the average PFS values for each treatment. Adapted from [25]. The bottom right figure shows the quality of life (QOL) scores of patients treated with radiotherapy for liver tumors, with or without H2 water, adapted from [27]. A higher score reflects more symptoms and lower QOL. * p < 0.05, ** p < 0.01, *** p < 0.001, for all figures.

