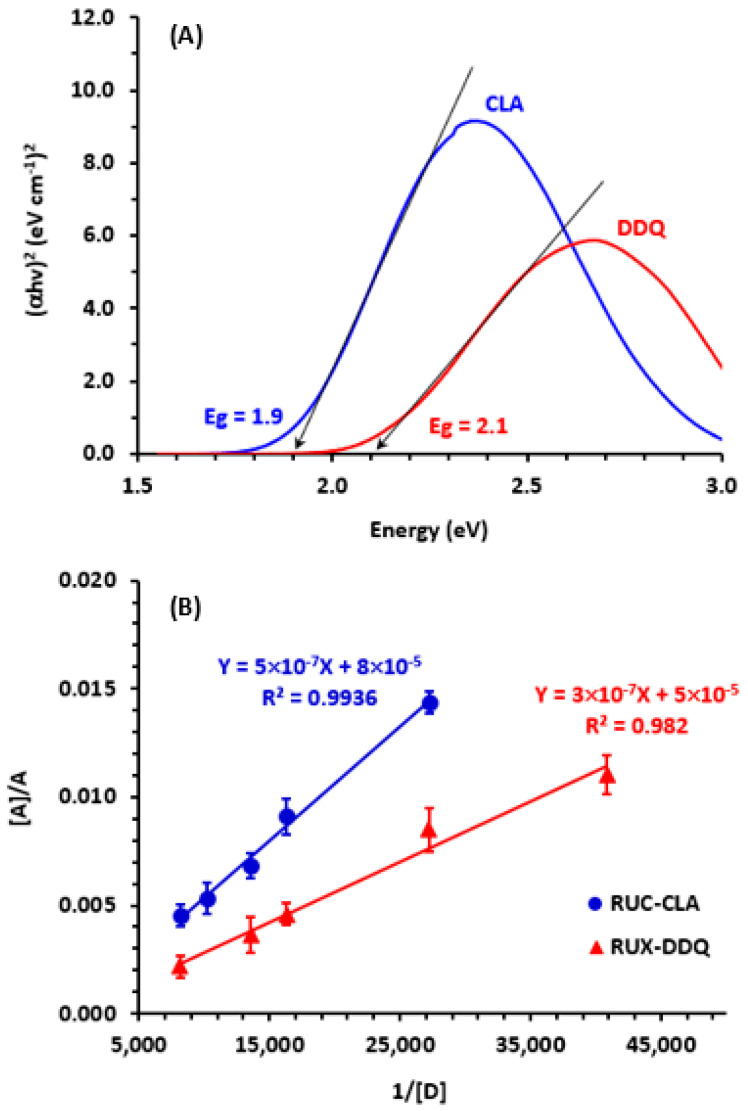
Figure 3.
Panel (A) Tauc plots of energy (hυ) against (αhυ)2 for CTCs of RUX with CLA and DDQ in methanol solvent. Panel (B) Benesi–Hildebrand plots for formation of the CTCs of RUX with CLA and DDQ. Linear fitting equations and their determination coefficients (R2) are provided on the plot. [A], A, and [D] are the molar concentration of the acceptor reagent (CLA or DDQ), absorbance of the CTC, and molar concentration of RUX, respectively. The values are the means of 3 measurements ± SD.

