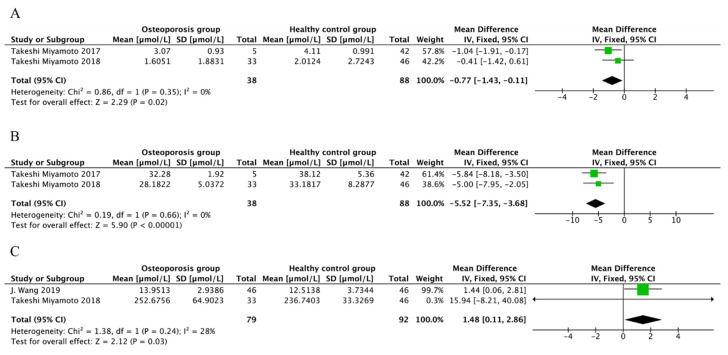
Figure 4.
Forest plot for different metabolites (μmol/L). (A) Forest plot of the concentration of gly-gly in OP patients and controls. Data from references [40,47]. The level of gly-gly decreased in OP group compared to the control group. (B) Forest plot of the concentration of cystine in OP patients and controls. Data from references [40,47]. The results reveal that the level of cystine decreased in OP group compared to the control group. (C) Forest plot of the concentration of LPC in OP patients and control. Data from references [33,47]. The level of LPC was higher in OP group than the control group. Note: The green boxes represent the point estimates for each study, and the black boxes represent the combined values of the study results.

