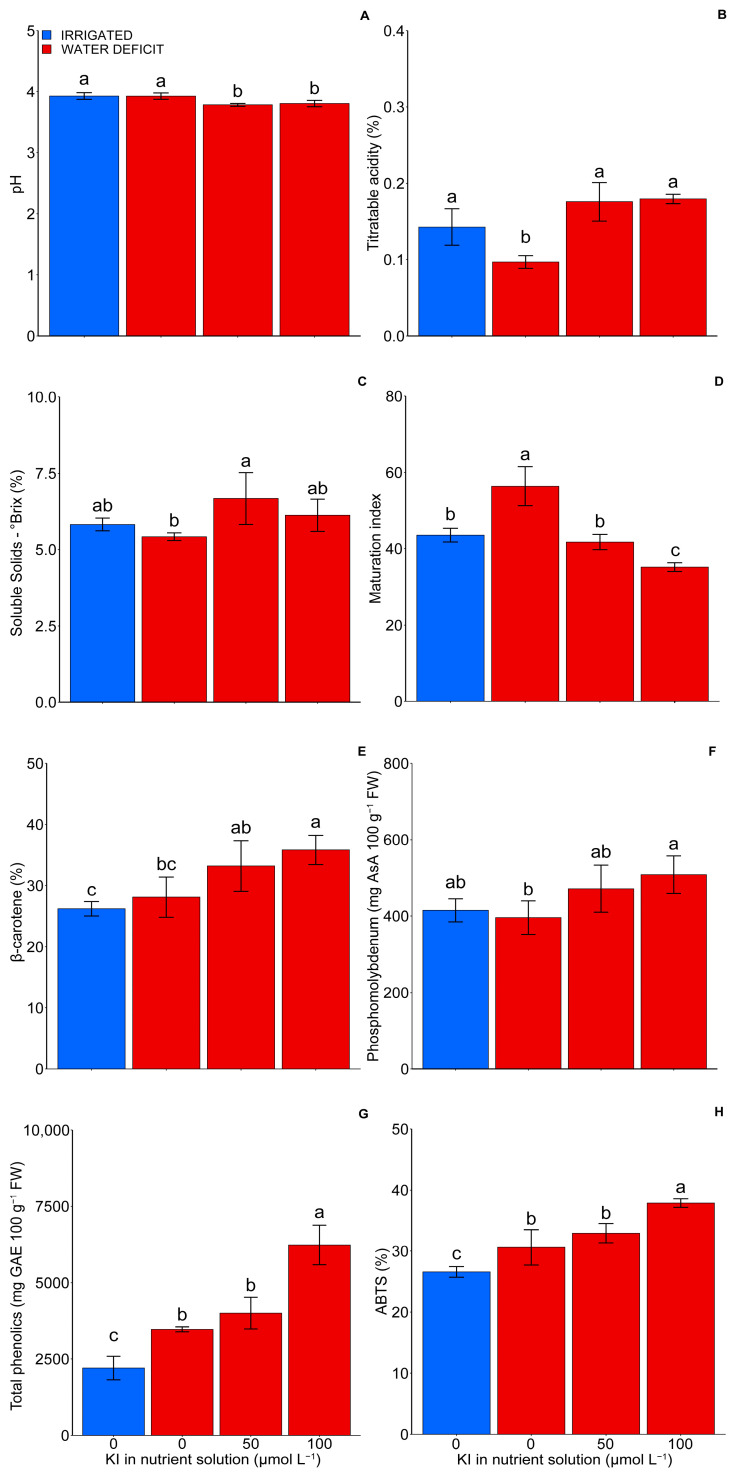
Figure 2.
Effect of KI on pH (A), titratable acidity (B), soluble solids (C), maturation index (D), β-carotene, (E) phosphomolybdenum (F), total phenolics (G), and ABTS (H) in tomato fruits under water deficit or not. The control treatment (without water deficit) corresponds to the blue bars (first bar), while the second, third, and fourth bars, in red, represent the water deficit condition and the treatments 0, 50, and 100 µmol L−1 of KI, respectively. Values are average ± SD (n = 4). The same letters indicate no significant difference (p > 0.05) in the Tukey test.

