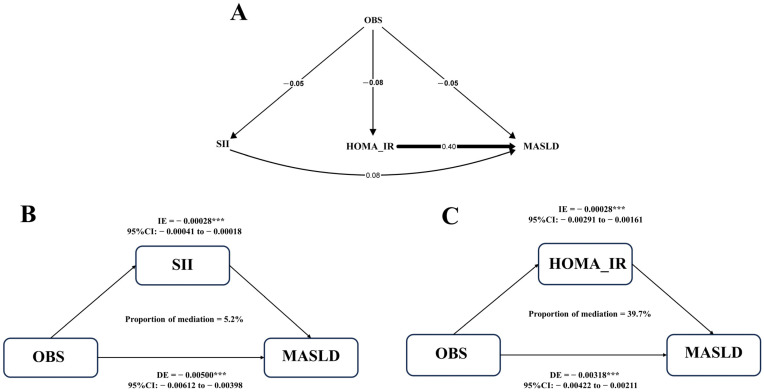
Figure 3.
Mediation analysis between OBS and MASLD. (A) Pathway models show associations between HOMA-IR, SII, and OBS with MASLD; (B) estimated proportion of the association between OBS and MASLD mediated by SII; (C) estimated proportion of the association between OBS and MASLD mediated by HOMA-IR. Model adjusted for age, sex, ethnicity, education, total energy intake, liver enzymes (ALT, AST), BMI, hypertension, hyperlipidemia, and diabetes. (MASLD = Metabolic dysfunction-associated steatotic liver disease; OBS = oxidative balance score; BMI = body mass index; SII = Systemic Inflammatory Index; HOMA-IR = Homeostasis model of insulin resistance; CI = Confidence interval; DE = Direct effect; IE = Indirect effect, ***: p < 0.001).

