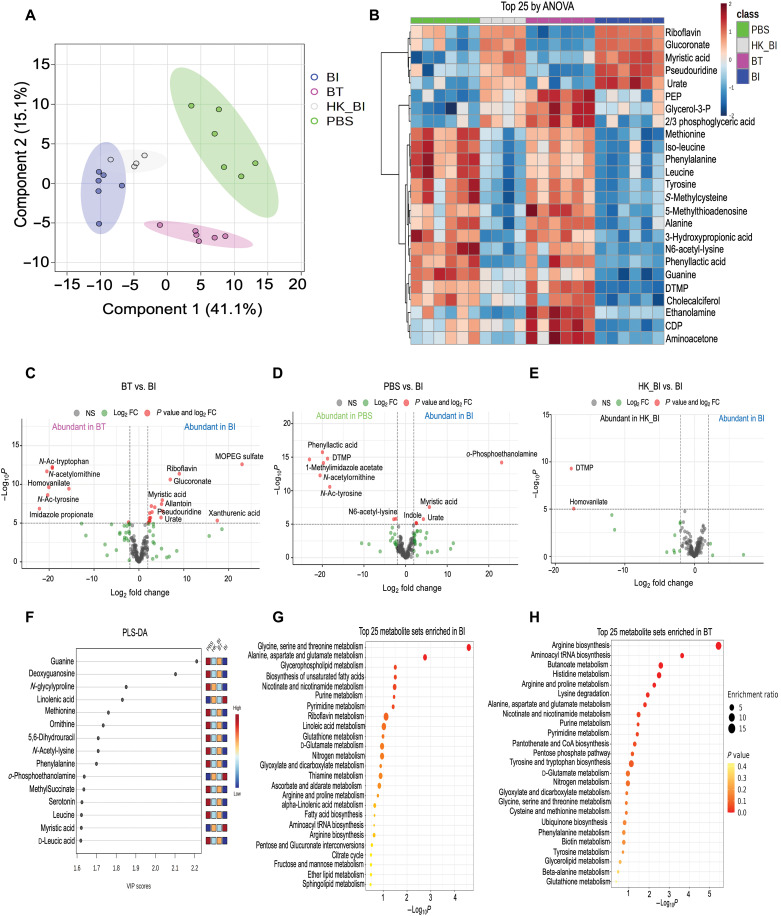
Fig. 6. BI and BT differentially affect the stool metabolome in unvaccinated mice at day 14 of life.
(A) PLS-DA analysis of fecal metabolite profiles of mice orally gavaged with PBS, BI, heat-killed B. infantis (HK_BI), or BT. (B) Heatmap showing supervised hierarchical clustering of the top 25 metabolites that were most different between groups by ANOVA. (C) Volcano plot comparing metabolite profile between BT and BI. (D) Volcano plot comparing metabolite profile between PBS and BI. (E) Volcano plot comparing metabolite profile between HK_BI and BI. (F) PLS-DA analysis showing the importance of fecal metabolites across all groups identified by VIP scores. (G) Dot plot showing enriched pathways in BI-gavaged mice. Size of the circle per pathway shows enrichment ratio, and color represents the P value. (H) Dot plot showing enriched pathways in BT-gavaged mice. Size of the circle per pathway shows enrichment ratio, and color represents the P value.

