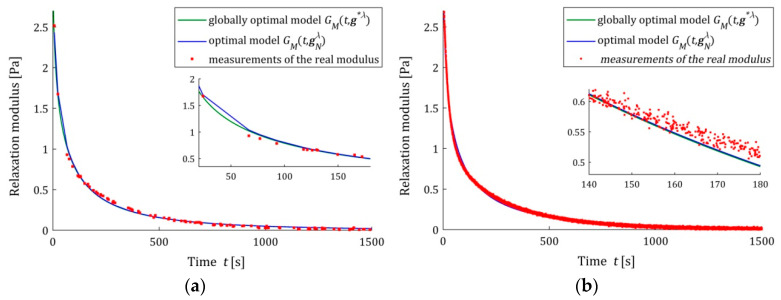
Figure 5.
The real relaxation modulus measurements (red points) and KWW models (28): sampling-instant-independent model (green lines) and optimal models (blue lines) for measurements and additive random noises of normal distribution with zero mean value and standard deviation : (a) ; (b) . The caret for variable has been omitted to simplify the legend description.

