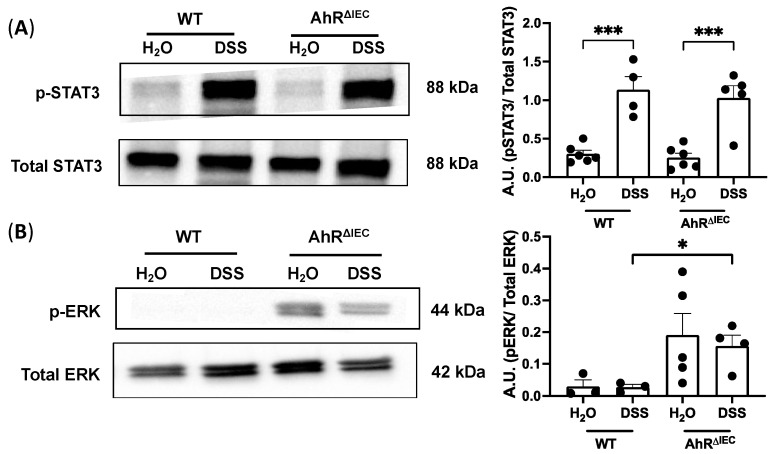
Figure 3.
Phosphorylated STAT3 and phosphorylated ERK levels in WT and AhRΔIEC mice. Western blots of (A) phosphorylated STAT3 normalized to total STAT3 and (B) phosphorylated ERK normalized to total ERK. Values are mean ± standard error of mean. Data were analyzed by one-way ANOVA; * p < 0.05, *** p < 0.001. A.U., arbitrary units.

