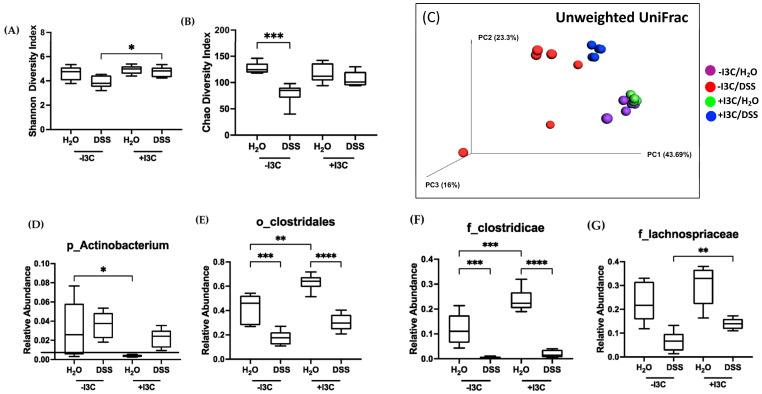
Figure 8.
Microbiota analysis of WT mice induced with chronic colitis and fed −I3C or +I3C diets. Cecal contents derived from WT mice induced with chronic colitis and fed the −I3C or +I3C diet were subject to 16S sequencing. Alpha diversity was assessed by (A) Shannon index and (B) Chao index. Beta diversity was assessed by (C) unweighted UniFrac. Relative abundance of (D) phylum Actinobacterium, (E) order Clostridales, (F) family Clostridicae, and (G) family Lachnospriaceae. Values are mean ± standard error of mean. Data were analyzed by one-way ANOVA; * p < 0.05, ** p < 0.01, *** p < 0.001, **** p < 0.0001.

