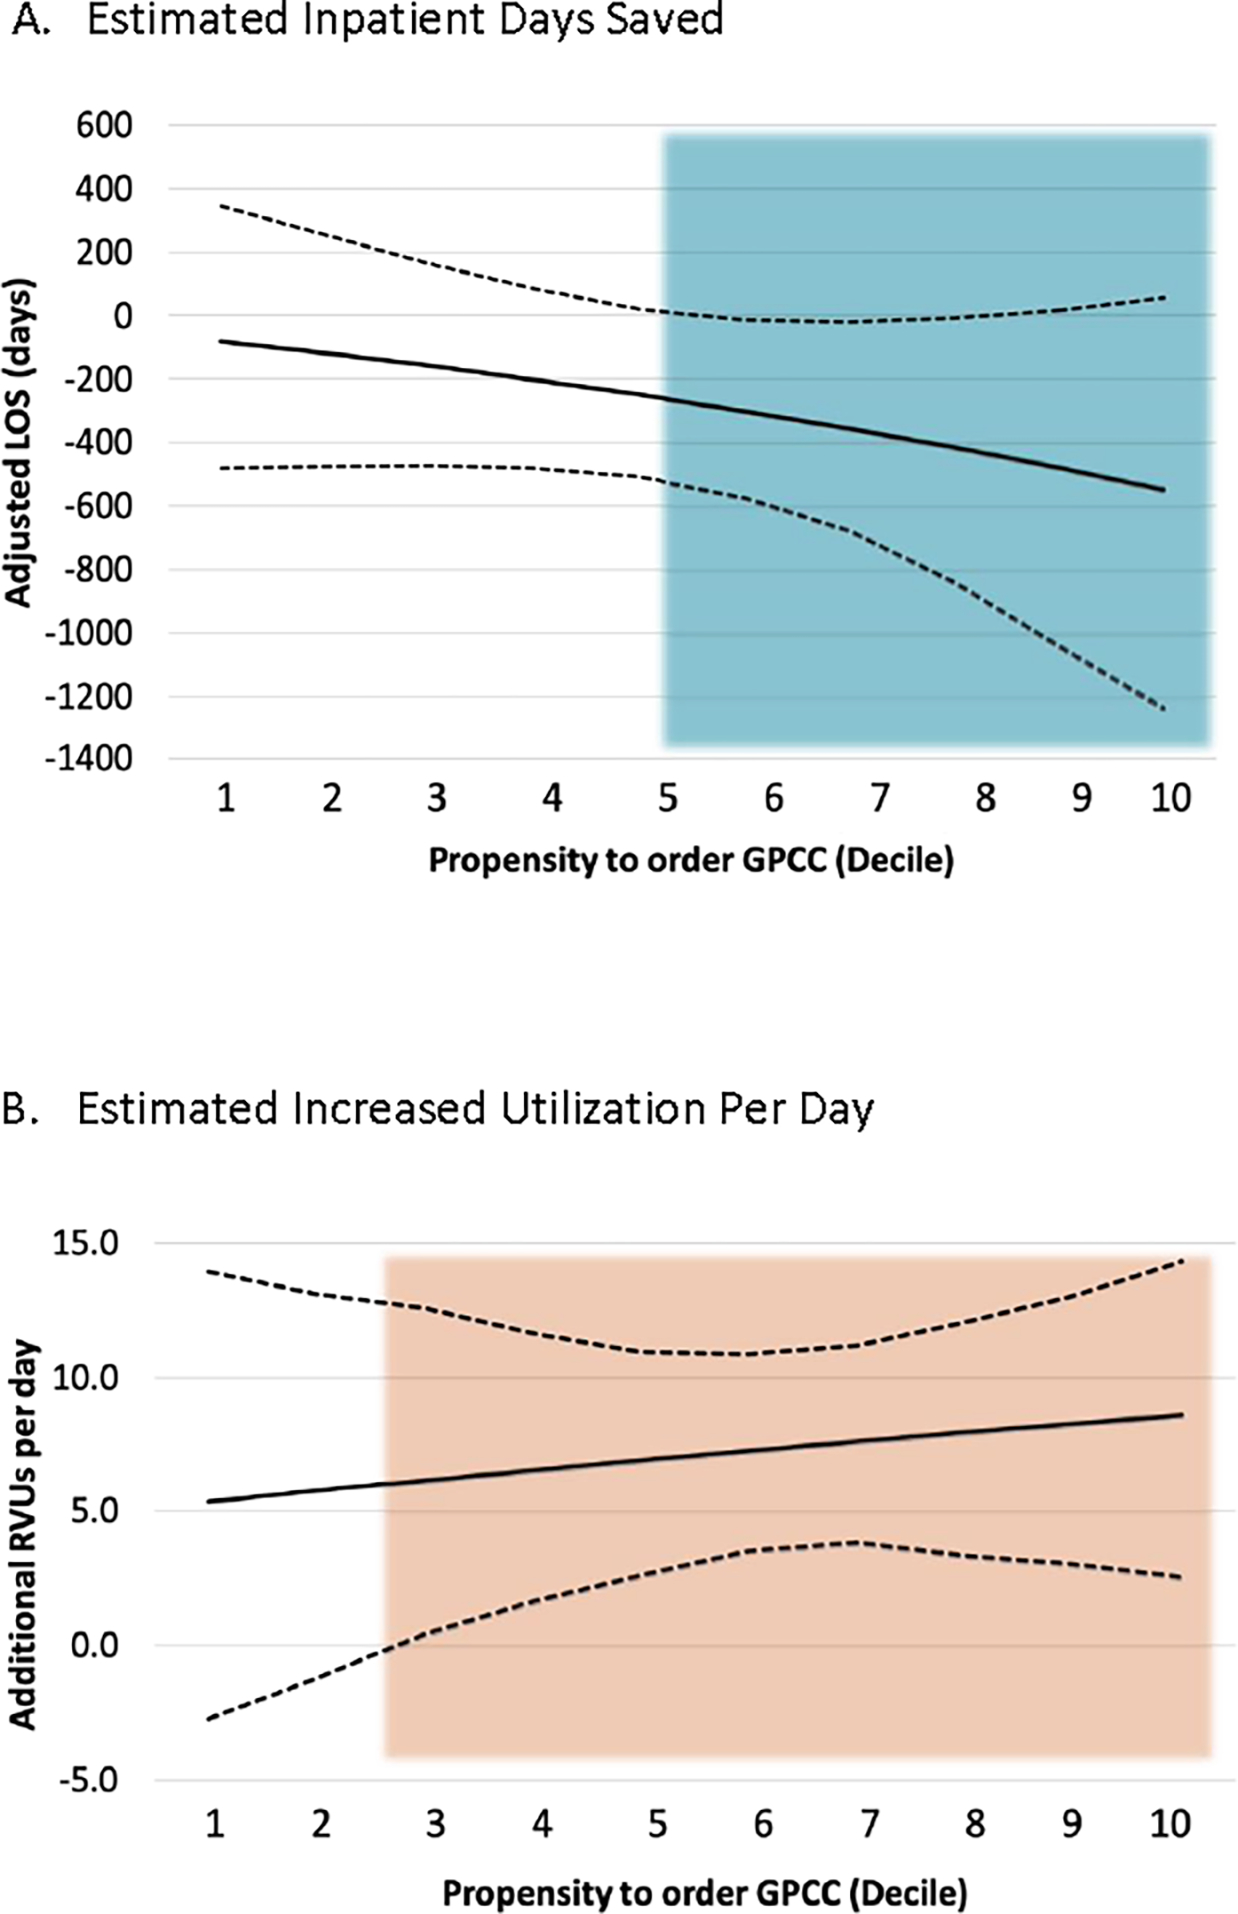
Figure 2. Estimated Intervention Effect for Older Patients of Increasing Propensity to Receive Palliative or Geriatric Consultation.

The estimated net effect of the intervention experienced by the two intervention teams for their older patients during the 1-year intervention, by increasing propensity to receive geriatric or palliative care consults (GPCC). Solid line = point estimate for that decile. Dotted line = Bootstrapped 95% confidence interval (percentile method). For length of stay, the annual benefit increased more among the patients in the top half (above 5th decile) of likelihood to receive GPCC. The additional utilization associated with the intervention group increased with increased propensity, statistically different from zero above the 3rd decile.
LOS = length of stay in days
RVU = relative value units
