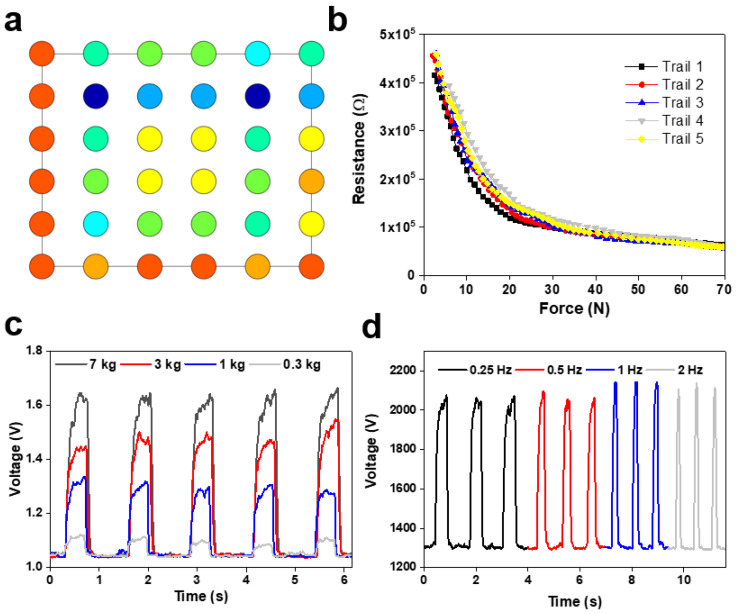
Figure 5.
Characteristics of the developed flexible pressure sensor array: (a) presentation of the 36 taxels as a color map that is proportional to pressure across the surface of the sensor (different color means different value of the sensor voltage); (b) chart displaying the sensitivity and operating range of the sensor; (c) the response of a single taxel at the application of varying force; (d) response of a single taxel at varying frequencies of application.

