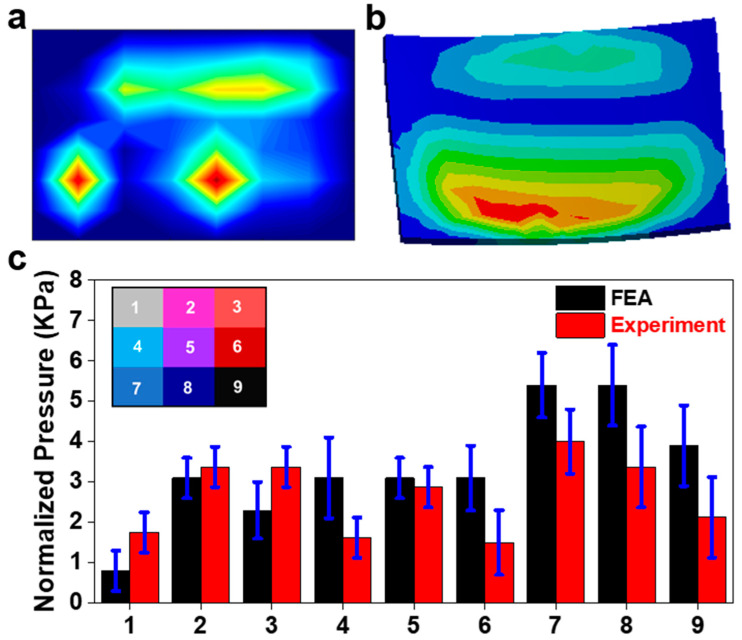
Figure 6.
Flexion application. (a) Pressure field from sensor array during the physical experiment (red color means higher value and blue color means lower value); (b) the pressure field from the sensor array FE model; (c) comparison of normalized pressure between FEA and experiment in nine areas with a map of their locations on the sensor.

