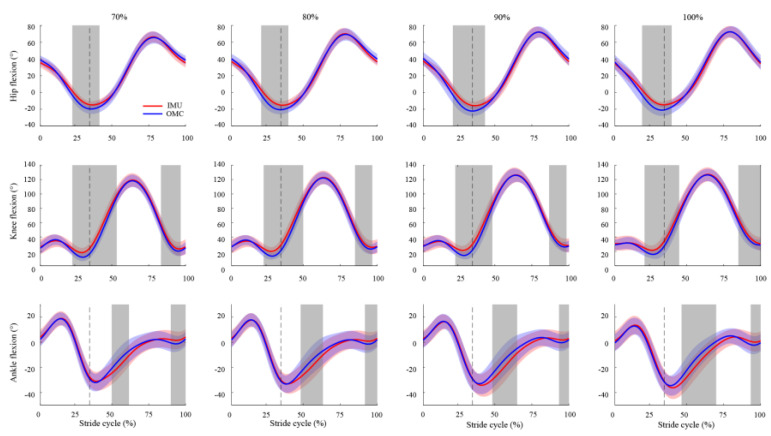
Figure 2.
Comparison of the sagittal plane hip, knee, and ankle joint angles throughout one stride cycle, between IMU-based (red) and OMC-based (blue) measurements, at different running speeds (70%, 80%, 90%, and 100% of the maximal running speed). Positive angles represent the hip flexion, knee flexion, and ankle dorsiflexion. The shaded areas (red and blue) represent ± 1 standard deviation from the mean values. The dashed vertical line indicates the end of the stance phase for each running speed. The grey area highlights significant differences in joint angles between the IMU and OMC systems, as indicated by SPM analysis.

