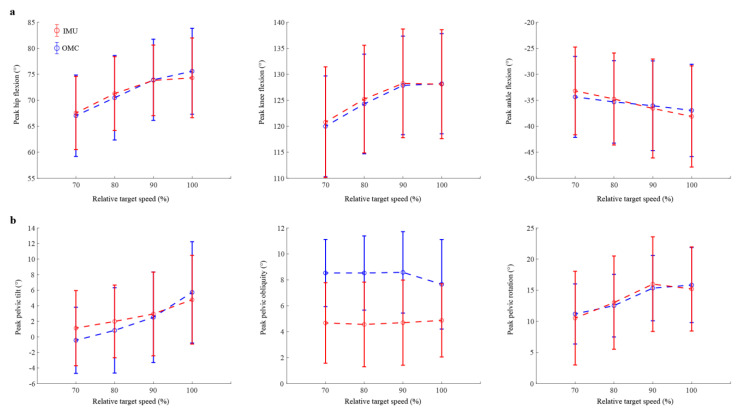
Figure 4.
(a) The peak flexion angles of the hip, knee, and ankle and (b) the pelvic orientation (tilt, obliquity, and rotation) during running at four different speeds. Results are presented as mean (open circles) plus and minus one standard deviation (vertical error bars) of the peak values obtained for 18 participants (refer to Supplementary Materials Figures S1–S6 for individual results).

