. 2023 Oct 24;12:e87255. doi: 10.7554/eLife.87255

Figure 3. Rab12 is recruited to lysosomes following lysosomal damage and promotes Rab10 phosphorylation at the lysosome.

(A) Lysosomes were isolated from wildtype (WT) and RAB12 KO A549 cells treated with vehicle or L-leucyl-L-leucine methyl ester (LLOMe) (1 mM) for 2 hr. The levels of pT73 Rab10, total Rab10, pS106 Rab12, galectin-3 (Gal3), lysosomal-associated membrane protein 1 (LAMP1), and HA were assessed by western blot analysis, and shown is a representative immunoblot. Fluorescence signals of immunoblots from multiple experiments were quantified. The pT73 Rab10 signal was normalized to the HA signal, then was normalized to the median within each experimental replicate and expressed as a fold change compared to lysosomes isolated from WT A549 cells treated with vehicle. n=6 independent experiments. Data are shown as the mean ± SEM, and statistical significance was determined using one-way analysis of variance (ANOVA) with Tukey’s multiple comparison test. (B) WT, RAB12 KO, and LRRK2 KO A549 cells were treated with vehicle or LLOMe (1 mM) for 2 hr, and the signals of pT73 Rab10 and LAMP1 were assessed by immunostaining. Scale bar, 20 μm. pT73 Rab10 (shown in magenta) and LAMP1 (shown in cyan) double positive puncta (i.e. overlap of magenta and cyan and shown in white) were quantified per cell from n=3 independent experiments. Data are shown as the mean ± SEM with and statistical significance was determined using two-way ANOVA with Sidak’s multiple comparison test. (C) Lysosomal Rab12 levels were assessed by western blot analysis from lysosomes isolated from WT and RAB12 KO A549 cells treated with vehicle or LLOMe (1 mM) for 2 hr. The Rab12 signals were normalized to the HA signals, then were normalized to the median within each experimental replicate and expressed as a fold change compared to lysosomes isolated from WT A549 cells treated with vehicle. n=6 independent experiments. Data are shown as the mean ± SEM, and statistical significance was determined using one-way ANOVA with Tukey’s multiple comparison test. (D) HEK293T cells expressing mCherry-Rab12 were treated with vehicle or LLOMe (1 mM) for 2 hr, fixed, and stained using an antibody against LAMP1. Colocalization of Rab12 and LAMP1 was assessed by measuring the Pearson’s correlation coefficient between mCherry-Rab12 (shown in magenta) and LAMP1 (shown in cyan); nocodazole (25 μΜ for 2 hr) treatment was included as a control to confirm colocalization. Scale bar, 10 μm. n=3 independent experiments. Data are shown as the mean ± SEM, and statistical significance was determined using repeated measures one-way ANOVA with Sidak’s multiple comparison test. (E) WT and LRRK2 KO A549 cells transiently expressing mCherry-Rab12 were treated with vehicle or LLOMe (1 mM) for 2 hr, and the LAMP1 levels were assessed by immunostaining. Scale bar, 20 μm. The intensity of mCherry-Rab12 signals (shown in magenta) in LAMP1 (shown in cyan)-positive region were quantified per cell from mCherry-Rab12 expressing cells (n=20 cells per condition, with cellular intensity between 2000 and 5000 fl. units) and averaged across wells (~4–6 wells per condition). n=3 independent experiments. The Rab12 signal was normalized to the median within each experimental replicate, and then expressed as a fold change compared to WT cells treated with vehicle. Data are shown as the mean ± SEM, and statistical significance was determined using one-way ANOVA with Sidak’s multiple comparison test. (F) HEK293T cells stably expressing eGFP-LRRK2 were transfected with mCherry-Rab12 and treated with LLOMe (1 mM) for 2 hr. Colocalization of mCherry-Rab12 (shown in magenta) and eGFP-LRRK2 (shown in cyan) was assessed by measuring the Pearson’s correlation coefficient in LLOMe-responding cells (n=10 cells per condition); nocodazole (25 μΜ) treatment was included to confirm colocalization. Scale bar, 10 μm. n=3 independent experiments. (G) HEK293T cells stably expressing eGFP-LRRK2 were treated with vehicle or LLOMe (1 mM) for 2 hr, fixed, and stained using an antibody against LAMP1. Colocalization of LRRK2 and LAMP1 was assessed by measuring the Pearson’s correlation coefficient between eGFP-LRRK2 (shown in cyan) and LAMP1 (shown in magenta); nocodazole (25 μΜ) treatment was included to confirm colocalization. Scale bar, 10 μm. n=3 independent experiments. Data are shown as the mean ± SEM, and statistical significance was determined using repeated measures one-way ANOVA with Sidak’s multiple comparison test. **p<0.01, ***p<0.001, and ****p<0.0001.

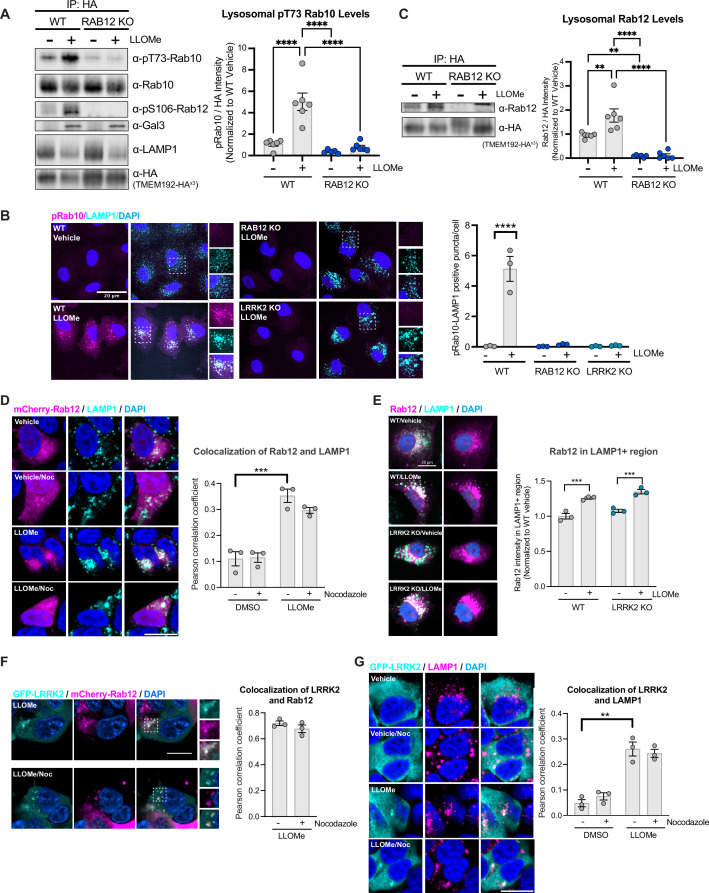
Figure 3—source data 1. Raw data files for western blot.
Figure 3—source data 2. Annotated western blots.

Figure 3.

Figure 3—figure supplement 1. Validation of lysosomal immunopurification method and analysis of pT73 Rab10 and Rab12 localization in response to lysosomal damage.

Figure 3—figure supplement 1.

(A) Wildtype (WT) A549 cells stably expressing TMEM192-3x-HA were treated with vehicle or L-leucyl-L-leucine methyl ester (LLOMe) (1 mM) for 2 hr, and HA (to detect TMEM192-3x-HA) and lysosomal-associated membrane protein 1 (LAMP1) signals were assessed by immunostaining. Scale bar, 20 μm. Percentage of HA (shown in magenta) and LAMP1 (shown in cyan) double positive puncta (i.e. overlap of magenta and cyan and shown in white) over total HA puncta were quantified per cell from n=3 independent experiments. Data are shown as the mean ± SEM. (B) Representative immunoblot from analysis of isolated lysosomes (IP: HA) and the post-nuclear supernatant (PNS) fraction (corresponding to Figure 3A) in WT and Rab12 KO A549 cells treated with vehicle or LLOMe (1 mM) for 2 hr. (C) Lysosomal Rab10 levels were assessed by western blot analysis from lysosomes isolated from WT and RAB12 KO A549 cells treated with vehicle or LLOMe (1 mM) for 2 hr. Rab10 levels were then normalized to the HA signal, then were normalized to the median within each experimental replicate and expressed as a fold change compared to lysosomes isolated from WT cells treated with vehicle (corresponding to Figure 3A); n=6 independent experiments. (D) pT73 Rab10 signals were assessed by immunostaining of WT, RAB12 KO, and LRRK2 KO A549 cells treated with vehicle or LLOMe (1 mM) for 2 hr (corresponding to Figure 3B). The sum intensity of puncta per cell was quantified from n=3 independent experiments. Data are shown as the mean ± SEM, and statistical significance was determined using two-way analysis of variance (ANOVA) with Sidak’s multiple comparison test. (E) Percentage of pT73 Rab10 puncta colocalized with LAMP1 were quantified from WT A549 cells treated with vehicle or LLOMe (1 mM) for 2 hr. Data are shown as the mean ± SEM, n=3 independent experiments. (F) Representative immunoblot from analysis of isolated lysosomes (IP: HA) and PNS (corresponding to Figure 3C) from WT and Rab12 KO A549 cells treated with vehicle or LLOMe (1 mM) for 2 hr. (G) HEK293T cells transiently expressing mCherry-Rab12 were treated with vehicle or LLOMe (1 mM) for 2 hr, fixed, and stained using an antibody against GM130 as a marker of the Golgi. Colocalization of Rab12 and GM130 was measured using the Pearson’s correlation coefficient between mCherry-Rab12 (shown in magenta) and GM130 (shown in yellow); nocodazole (25 μΜ) treatment was included to confirm colocalization. Scale bar, 10 μm. n=3 independent experiments. Data are shown as the mean ± SEM, and statistical significance was determined using repeated measures one-way ANOVA with Sidak’s multiple comparison test.
Figure 3—figure supplement 1—source data 1. Raw data files for western blot.
Figure 3—figure supplement 1—source data 2. Annotated western blots.
Figure 3—figure supplement 2. Analysis of Rab12 and LRRK2 localization at baseline and in response to lysosomal damage.

Figure 3—figure supplement 2.

(A) Lysosomal Rab12 levels were assessed by western blot analysis from lysosomes isolated from wildtype (WT), LRRK2 R1441G, and LRRK2 KO A549 cells treated with vehicle or L-leucyl-L-leucine methyl ester (LLOMe) (1 mM) for 2 hr. The Rab12 signals were normalized to the median within each experimental replicate and expressed as a fold change compared to lysosomes isolated from WT A549 cells treated with vehicle. n=3 independent experiments. Data are shown as the mean ± SEM and statistical significance was determined using one-way analysis of variance (ANOVA) with Tukey’s multiple comparison test. (B) Representative live-cell images show the recruitment of Rab12 and LRRK2 upon LLOMe (1 mM) treatment. HEK293T cells were transfected with mCherry-Rab12 and eGFP-LRRK2, and images were acquired every 10 min. Scale bar, 5 μm. (C–E) Normalized mean intensity of mCherry-Rab12 (C) and eGFP-LRRK2 (D) were quantified over time in segmented cells (n=24 cells). (E) Pearson’s correlation coefficient (PCC) between normalized eGFP-LRRK2 and mCherry-Rab12 were quantified over time in segmented cells (n=24 cells); n=3 experiments. Data are shown as mean ± SEM. (F) HEK293T cells stably expressing eGFP-LRRK2 were treated with vehicle or LLOMe (1 mM) for 2 hr, fixed, and stained using an antibody against the Golgi marker GM130. Colocalization of LRRK2 and GM130 was assessed by measuring the PCC between eGFP-LRRK2 (shown in cyan) and GM130 (shown in yellow); nocodazole (25 μΜ) treatment was included to confirm colocalization. Scale bar, 10 μm; n=3 independent experiments. Data are shown as the mean ± SEM, and statistical significance was determined using repeated measures one-way ANOVA with Sidak’s multiple comparison test. (G) The percentage of total Rab12 and LRRK2 localized to lysosomes was assessed using western blot analysis of lysosomes isolated from A549 cells treated with vehicle or LLOMe and estimated based on the signals of Rab12 and LRRK2 in the lysosomal fraction normalized to the signals in the post-nuclear supernatant (PNS) fraction. Our analysis of total HA recovery from isolated lysosomes confirmed that not all of the HA-labeled lysosomes were captured, suggesting that the estimated lysosomal LRRK2 and Rab12 levels using this method are likely an underestimate; n=4–6 experiments. Data are shown as the mean ± SEM, and statistical significance was determined using unpaired t-test. (H) The percentage of Rab12 and LRRK2 localized to lysosomes was assessed using imaging-based analysis. HEK293T cells transfected with either mCherry-Rab12 or eGFP-LRRK2 were treated with vehicle or LLOMe, fixed, and stained using an antibody against lysosomal-associated membrane protein 1 (LAMP1). The percentage of Rab12 and LRRK2 localized to lysosomes was quantified using the sum intensity of Rab12 or LRRK2 in the LAMP1-positive region normalized to the sum intensity of Rab12 or LRRK2 in the whole cell region. n=3–4 experiments. The data were normalized to the median within each experiment. Data are shown as the mean ± SEM, and statistical significance was determined using unpaired t-test. *p<0.05, **p<0.01, ***p<0.001, ****p<0.0001.