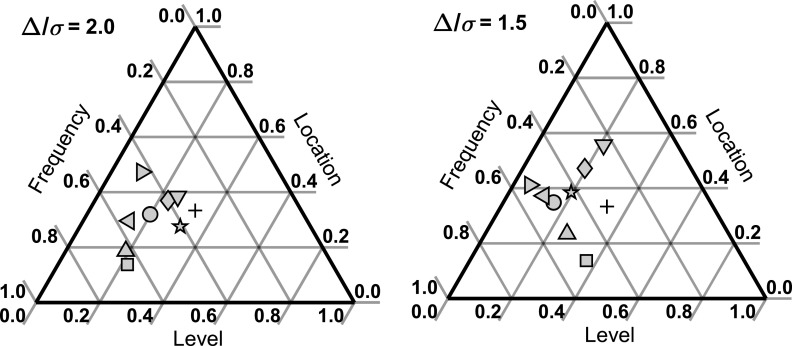
FIG. 1.
Ternary plots showing the estimates of relative decision weights w on fundamental frequency, Fo, location, θ, and level, L, for the first group of eight listeners, different symbols identifying the different listeners. The + symbol denotes the optimal relative decision weights for the task. Left and right panels are for the conditions targeting two different levels of performance.

