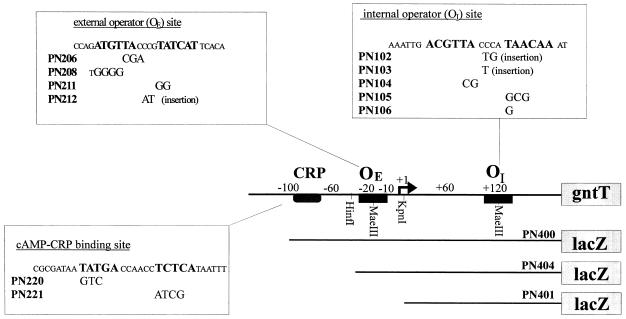
FIG. 3.
Schematic representation of the gntT promoter region showing the site-directed mutations within the two operator sites and the cAMP-CRP binding site. The binding sites are shown in boldface; the specific mutations are indicated below the wild-type binding sequences. The deletion subclones (PN400, PN401, and PN404) of the gntT promoter region are shown under the line map.

