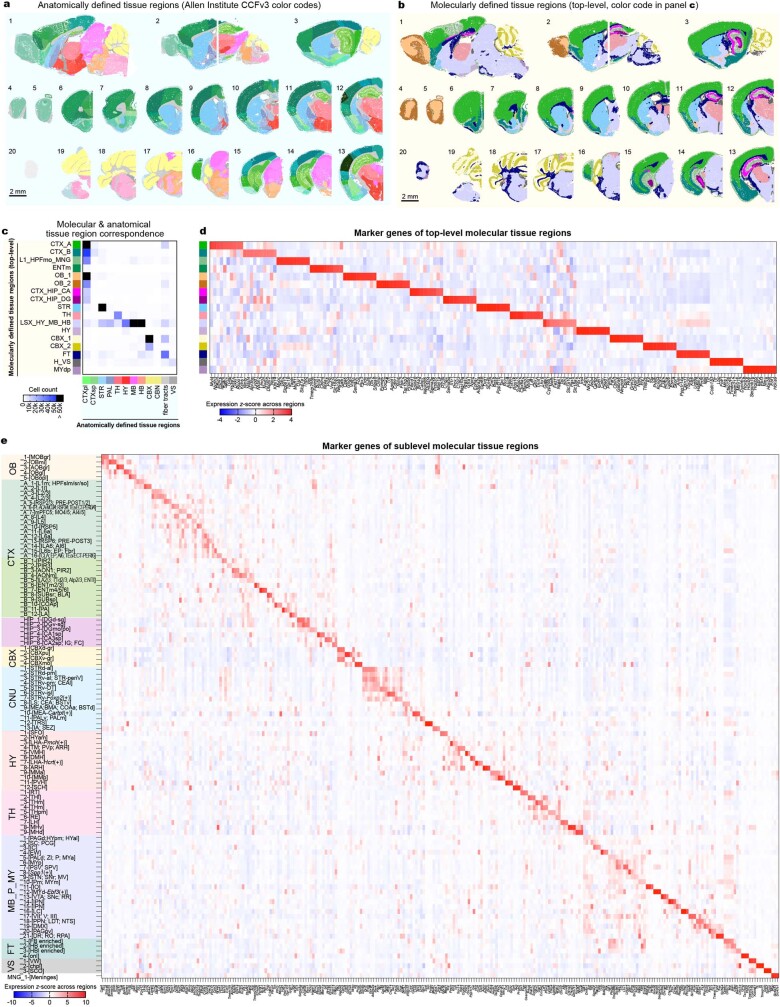
Extended Data Fig. 5. Brain anatomy registration (Allen CCFv3) and marker genes of molecular tissue regions.
a,b, Spatial plots of 20 sample slices coloured by CCF anatomical labels according to the Allen Institute 3D Mouse Brain Atlas20 (a) and top-level molecularly defined tissue regions (b). Each dot represents a cell. c, Heatmap showing the correspondence between main anatomical regions and top-level molecularly defined tissue regions. d,e, Marker gene heatmaps for top-level molecular tissue regions (top ten markers per region, ranked by z-scores of mean expression across regions, d) and sublevel molecular tissue regions (top three markers per region, ranked by z-scores of mean expression across regions, e). Tissue region abbreviations: OB, olfactory bulb; CTX, cerebral cortex; CBX, cerebellar cortex; CNU, cerebral nuclei; TH, thalamus; HY, hypothalamus; MB_P_MY, midbrain, pons, and medulla; FT, fibre tracts; VS, ventricular systems; H, habenula; MYdp, medulla, dorsoposterior part; HPFmo, non-pyramidal area of hippocampal formation; MNG, meninges; ENTm, entorhinal area, medial part; HIP, hippocampal region; DG, dentate gyrus; STR, striatum; CTXpl, cortical plate; LSX, lateral septal complex; PAL, pallidum; HB, hindbrain; CBN, cerebellar nuclei. Data are provided in the accompanying Source Data file.

