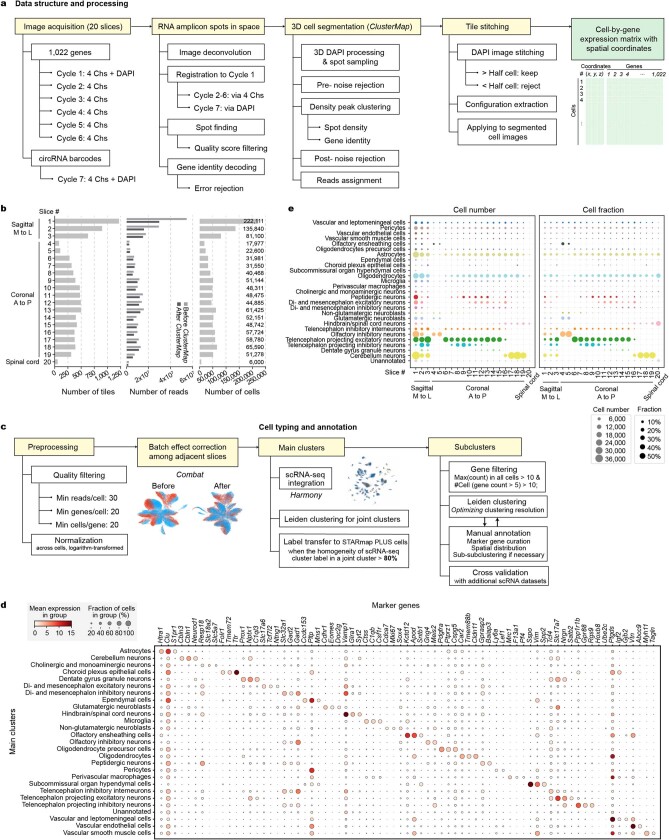
Extended Data Fig. 2. Spatial cell typing workflow and data quality.
a, Data structure of the study and the workflow from raw images to a cell-by-gene matrix with cell spatial coordinates. Chs, channels. b, Summary of the number of tiles (i.e., imaging area), reads and cells in each tissue sample slice. The number of cells is labeled on the figure. c, Workflow of cell quality control, batch correction and cell typing. Key parameters and thresholds were labeled. d, Dot plots of the top three marker genes for each main cluster. e, Main-cluster cell-type composition of each tissue sample slice as in absolute cell number (left) and cell fraction normalized within each tissue slice (right). M, medial; L, lateral; A, anterior; P, posterior. Data are provided in the accompanying Source Data file.

