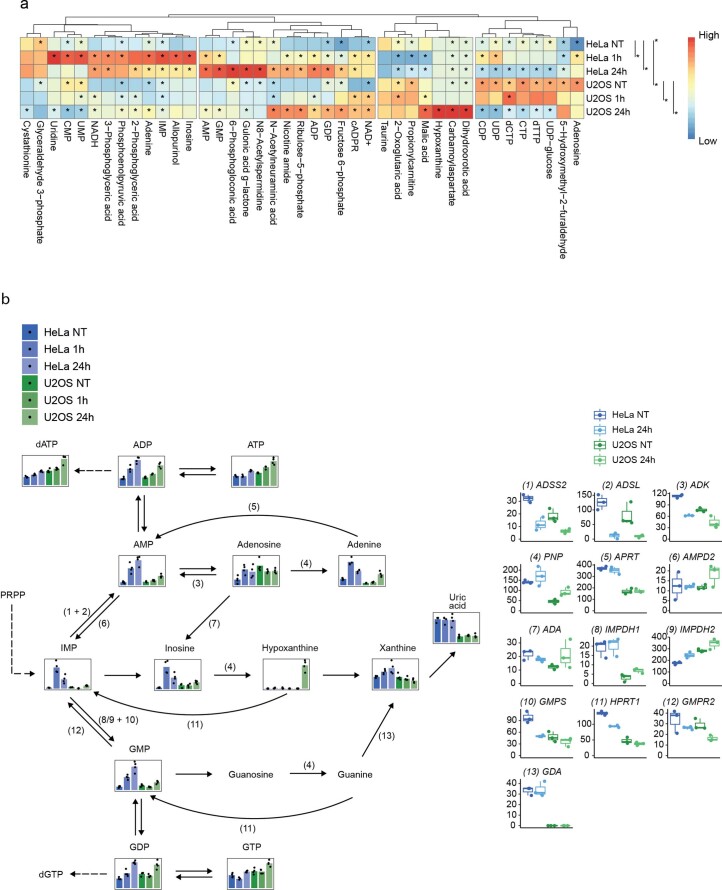
Extended Data Fig. 5. Metabolomic analysis of cells treated with NAD+.
a, Heatmap of metabolite levels (n = 4 biological replicates of individual samples collected from 4 different experiments) from HeLa and U2OS cells treated without (NT) or with 2 mM NAD+ as indicated. Asterisks for metabolites indicate significant differences between the indicated conditions (adjusted p-value < 0.05, FDR-adjusted p-values from two-tailed Student’s t-test). Asterisks for metabolites for HeLa NT and U2OS NT indicate significant differences between the two untreated cell lines. b, Purine synthesis and metabolic pathways with metabolite levels (left) and gene expression levels (right) from metabolomics and RNA-seq analysis, respectively. HeLa and U2OS cells were treated without (NT) or with 2 mM NAD+ for the indicated time. In metabolite plots, the y-axis shows relative metabolite quantification, bars represent means, n = 4 biological replicates of individual samples collected from 4 different experiments. In gene expression plots, the y-axis shows normalized counts, n = 3 independent biological samples per condition sequenced once with multiplexing. Dashed lines indicate multiple synthesis steps. For boxplots in panel b, the center line indicates the median; box limits indicate the 25th and 75th percentiles; minima and maxima of whiskers extend 1.5 times the inter-quartile range from 25th and 75th percentiles, respectively. Numerical data are available in Source Data Files.

