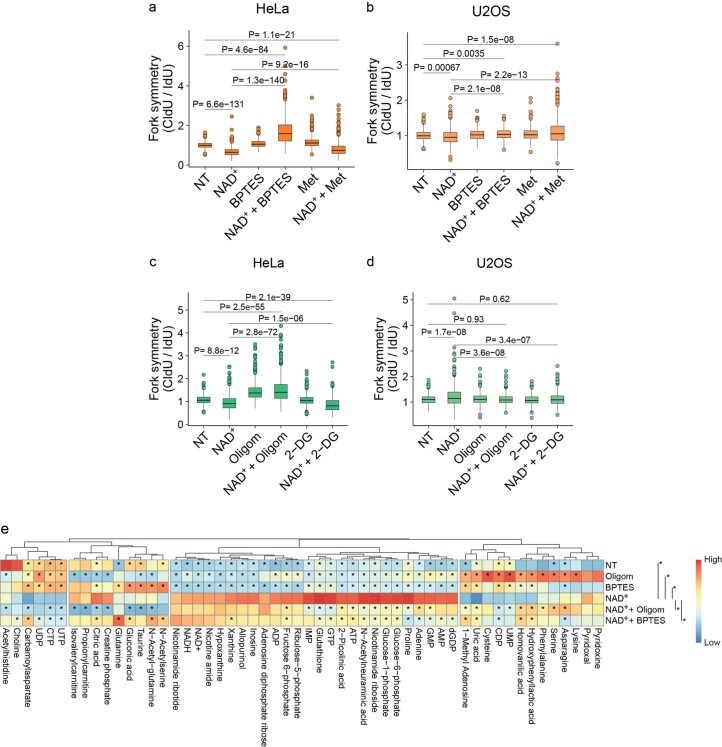
Extended Data Fig. 7. Metabolomics analysis of cells co-treated with NAD+, oligomycin and BPTES.
a, Symmetry of forks from Fig. 4c. b, Symmetry of forks from Fig. 4d. c, Symmetry of forks from Fig. 4e. d, Symmetry of forks from Fig. 4f. e, Heatmap of metabolite levels (n = 4 biological replicates of individual samples collected from 4 different experiments) from HeLa cells treated for 24 h without (NT) or with 5 µM oligomycin (Oligom), 10 µM BPTES, and/or 2 mM NAD+. Asterisks for metabolites indicate significant differences to NAD+-treated cells (adjusted p-value < 0.05, FDR-adjusted p-values from two-tailed Student’s t-test). Replication forks were scored for two biological replicates, two-tailed Welch’s t-test. For boxplots in panels a,b,c,d, the center line indicates the median; box limits indicate the 25th and 75th percentiles; minima and maxima of whiskers extend 1.5 times the inter-quartile range from 25th and 75th percentiles, respectively. Numerical data are available in Source Data Files.

