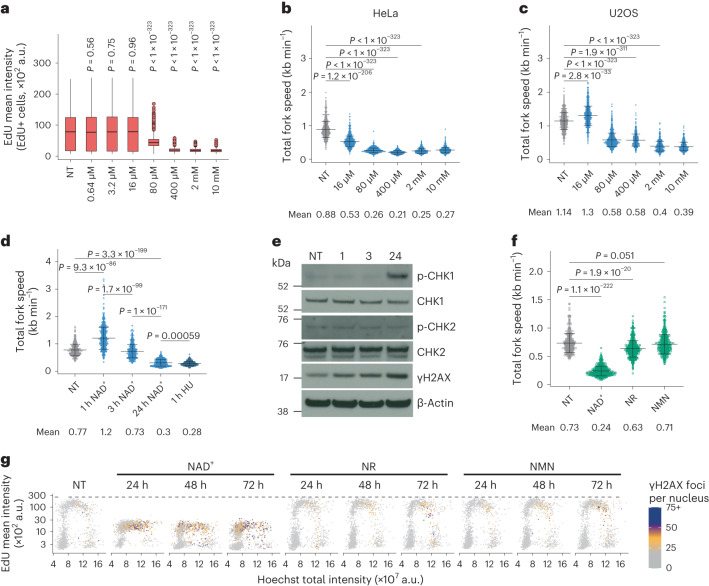
Fig. 2. Exogenous NAD+ induces replication stress.
a, QIBC analysis of EdU-positive HeLa cells treated for 24 h with NAD+. Cells quantified: non-treated (NT), 7,540; 0.64 µM, 7,557; 3.2 µM, 7,472; 16 µM, 6,935; 80 µM, 12,107; 400 µM, 13,322; 2 mM, 13,068; 10 mM, 12,874, from three biological replicates. Two-tailed Welch’s t-test compared with NT. b,c, Replication fork speed from HeLa (b) and U2OS (c) cells treated for 24 h with NAD+. Scored forks in b: non-treated (NT), 874; 16 µM, 879; 80 µM, 821; 400 µM, 526; 2 mM, 513; 10 mM, 543. Scored forks in c: NT, 1,022; 16 µM, 787; 80 µM, 1,088; 400 µM, 507; 2 mM, 592; 10 mM, 561. d, Replication fork speed from HeLa cells treated with 2 mM NAD+ or HU. Scored forks: non-treated (NT), 464; 1 h NAD+, 565; 3 h NAD+, 539; 24 h NAD+, 577; 1 h HU, 380. e, Immunoblot from HeLa cells treated without (NT) or with 2 mM NAD+ for the indicated hours. The experiment was performed twice with similar results. f, Replication fork speed from HeLa cells treated for 24 h with NAD+, NR or NMN at 2 mM. Scored forks: non-treated (NT), 406; NAD+, 560; NR, 518; NMN, 526. g, QIBC analysis of γH2AX foci, EdU intensity and DNA content in HeLa cells treated without (NT) or with NAD+, NR or NMN at 2 mM. Representative experiment from two (24 h NAD+, 24 h NMN, 48 h NMN, 72 h NMN, 72 h NR) and three (all other conditions) independent experiments. Replication fork data are mean ± s.d., means are indicated, forks were scored for two biological replicates, two-tailed Welch’s t-test. For boxplots in a, centre line indicates the median; box limits indicate the 25th and 75th percentiles; minima and maxima of whiskers extend 1.5 times the inter-quartile range from 25th and 75th percentiles, respectively. Numerical data and uncropped immunoblots are available in source data files.

