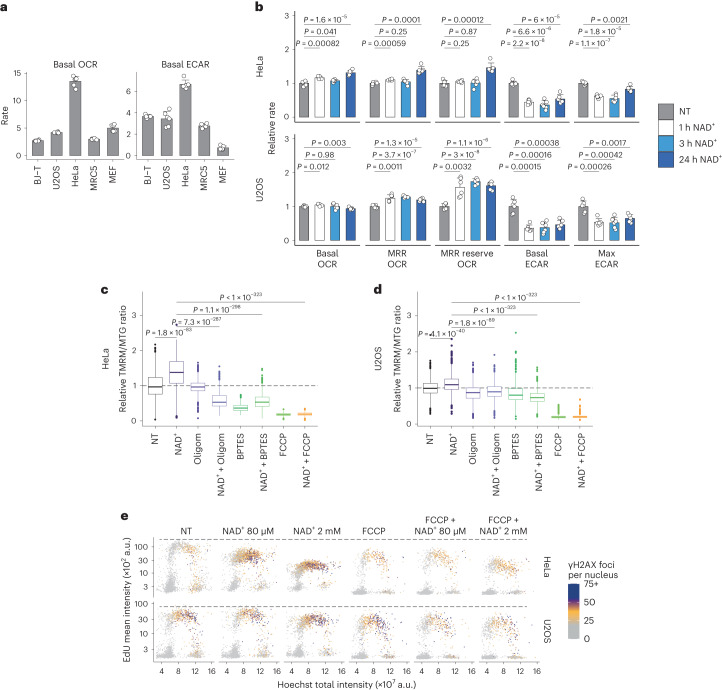
Fig. 5. NAD+ treatment affects mitochondrial respiration.
a, Basal OCR and ECAR for the indicated cell lines. Data are mean + s.d. Independent experiments, n = 5 (BJ-T) and n = 6 (all other cell lines). b, Metabolic parameters from mitochondrial stress analysis relative to non-treated (NT) cells. HeLa and U2OS cells were treated with 2 mM NAD+ as indicated. Data are mean + s.d., n = 6 independent experiments, two-tailed Welch’s t-test. MRR, maximum respiratory rate. c,d, QIBC analysis of mitochondrial membrane potential in HeLa (c) and U2OS (d) cells using TMRM and MTG cell-permeant dyes. The ratios of TMRM and MTG intensities are normalized to non-treated (NT) cells. Cells were treated for 24 h with 2 mM NAD+, 5 µM oligomycin (Oligom), 10 µM BPTES and/or 10 µM FCCP. Cells quantified in c: NT, 1,570; NAD+, 923; Oligom, 2,107; NAD+ + Oligom, 1,518; BPTES, 1,274; NAD+ + BPTES, 1,258; FCCP, 1,261; NAD+ + FCCP, 1,330. Cells quantified in d: NT, 1,177; NAD+, 2,025; Oligom, 821; NAD+ + Oligom, 808; BPTES, 635; NAD+ + BPTES, 1,029; FCCP, 634; NAD+ + FCCP, 462. Data are from a representative experiment performed twice with similar results. Two-tailed Welch’s t-test. e, QIBC analysis of γH2AX foci, EdU intensity and DNA content in HeLa and U2OS cells treated for 24 h without (NT) or with NAD+ as indicated and/or 10 µM FCCP. Representative experiment from two independent experiments. For boxplots in c and d, the centre line indicates the median; box limits indicate the 25th and 75th percentiles; minima and maxima of whiskers extend 1.5 times the inter-quartile range from 25th and 75th percentiles, respectively. Numerical data are available in source data files.

