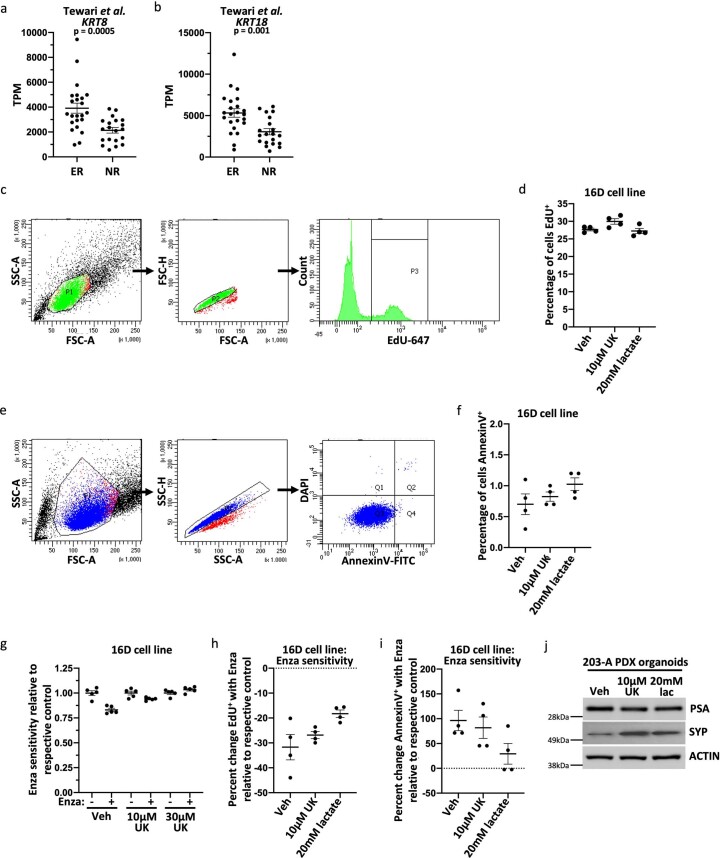
Extended Data Fig. 10. Modulation of lactate metabolism alters antiandrogen response and lineage identity in human models of prostate cancer.
(a-b) RNA abundance of KRT8 (a) or KRT18 (b) in non-responders (NR) or exceptional responders (ER) from the Tewari et al. dataset36, which contains RNA sequencing of pre-treatment localized prostate cancer biopsies from 43 patients enrolled in neoadjuvant trials of androgen pathway inhibition. p-values were calculated using an unpaired two-tailed t-test with Welch’s correction. (c) Flow cytometry gating scheme for data in panels (d,h). (d) Percentage of cells EdU+ in 16D cells treated with vehicle, 10 μM UK5099, or 20 mM lactate for seven days (n = 4 independent biological replicates). (e) Flow cytometry gating scheme for data in panels (f,i). (f) Percentage of cells AnnexinV+ in 16D cells treated with vehicle, 10 μM UK5099, or 20 mM lactate for seven days (n = 4 independent biological replicates). (g) Luminescence signal relative to respective control from CellTiter-Glo assay in 16D cell line treated with vehicle, 10 μM UK5099, or 30 μM UK5099 for seven days before beginning 48 hours of 10 μM Enzalutamide treatment (n = 5 independent biological replicates). (h-i) Percent change EdU+ (h) and AnnexinV+ (i) with 10 μM Enzalutamide treatment relative to respective control in 16D cell line (n = 4 independent biological replicates). (j) Western blot analysis of PSA and Synaptophysin (SYP) in 203-A PDX-derived organoids. For all panels, error bars represent SEM.

