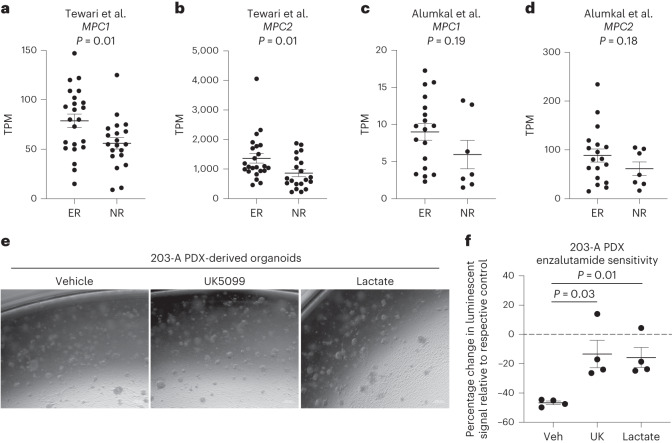
Fig. 6. Modulation of lactate metabolism alters antiandrogen response in prostate cancer.
a,b, RNA abundance of MPC1 (a) or MPC2 (b) in nonresponders (NR) or exceptional responders (ER) from the Tewari et al. dataset36, which contains RNA-seq of pre-treatment localized prostate cancer biopsies from 43 patients enrolled in neoadjuvant trials of androgen pathway inhibition. c,d, mRNA abundance of MPC1 (c) or MPC2 (d) in NR or ER from the Alumkal et al. dataset37, which contains RNA-seq of metastatic castration-resistant prostate cancer biopsies from 25 patients enrolled in neoadjuvant trials of androgen pathway inhibition. e, Representative phase contrast images of MDA PCa 203-A PDX-derived organoids treated with vehicle, 10 μM UK5099 or 20 mM sodium lactate for 7 d. f, Percentage change in luminescence signal with 10 μM enzalutamide treatment from CellTiter-Glo assay in castration-resistant MDA PCa 203-A PDX-derived organoids treated with vehicle, 10 μM UK5099 or 20 mM sodium lactate for 7 d before beginning 10 μM enzalutamide treatment (n = 4 independent biological replicates). For all panels, error bars represent s.e.m. P values were calculated using an unpaired two-tailed t-test with Welch’s correction.

