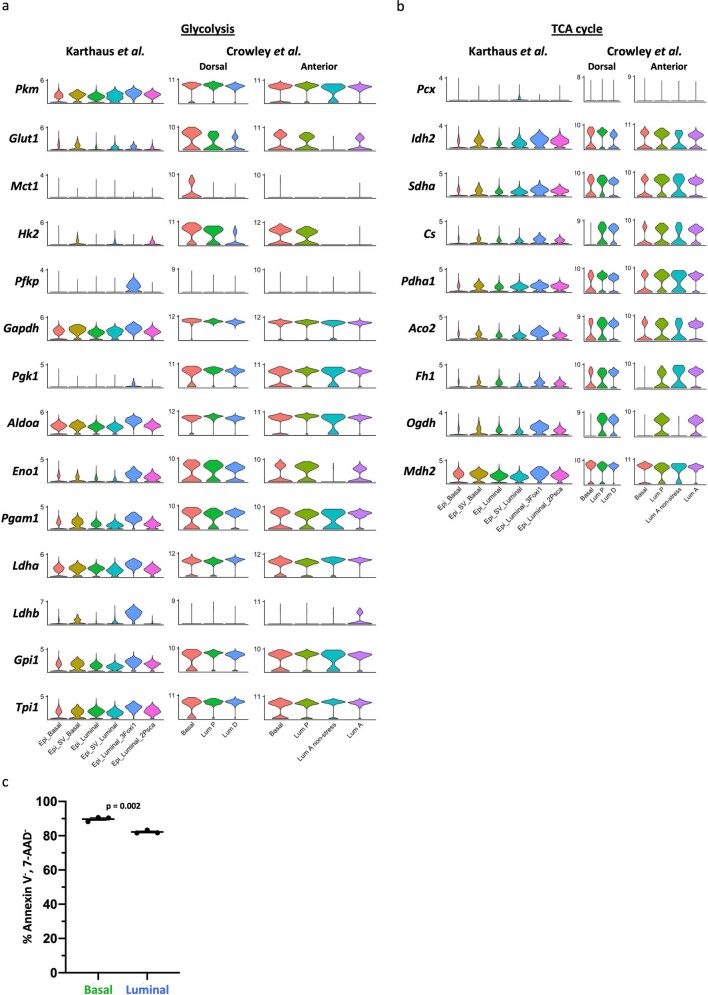
Extended Data Fig. 2. Basal and luminal prostate epithelial cells have distinct metabolic features.
(a-b) Analysis of glycolytic (a) and TCA cycle (b) enzymes in Karthaus et al25. and Crowley et al20. mouse single cell RNA sequencing data. (c) Percentage of Annexin V−, 7-AAD− primary basal and luminal cells after overnight culture (n = 3 independent biological replicates). Error bars represent SEM. p-values were calculated using an unpaired two-tailed t-test with Welch’s correction.

