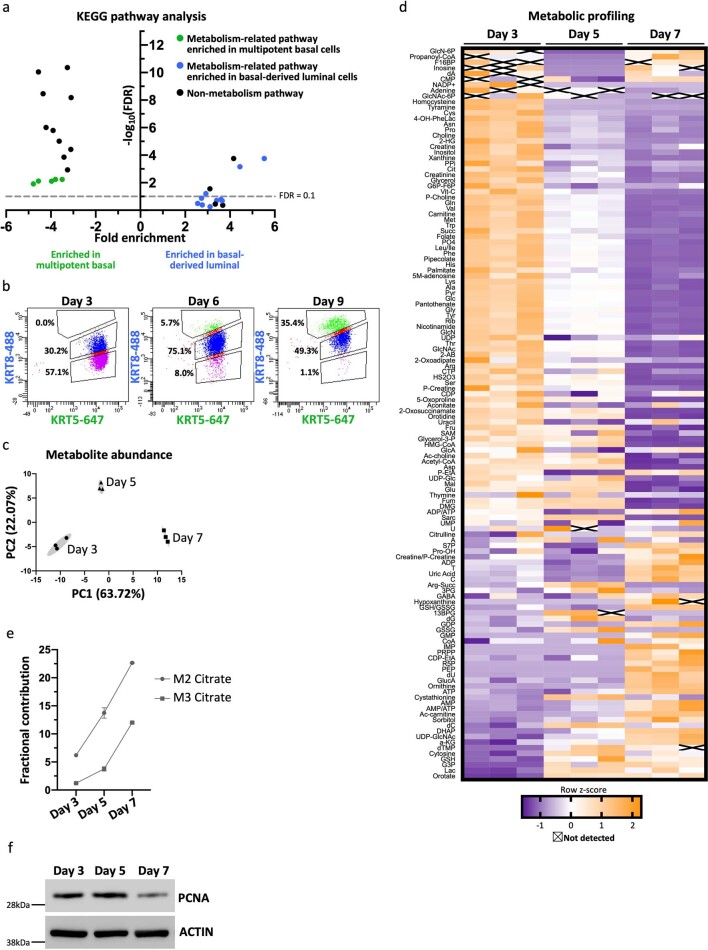
Extended Data Fig. 3. Basal to luminal differentiation is associated with metabolic reprogramming.
(a) 30 pathways most enriched in differentially abundant genes (log2(fold change) ≥ 1) in multipotent basal cells and basal-derived luminal cells identified by KEGG pathway analysis. Metabolism-related pathways highlighted in green (enriched in multipotent basal-enriched) and blue (enriched in basal-derived luminal-enriched). (b) Intracellular flow cytometry analysis of the basal marker cytokeratin 5 (KRT5) and the luminal marker cytokeratin 8 (KRT8) in primary basal-derived mouse organoids three, six and nine days after plating into organoid culture. (c) Principal component analysis of metabolic profiling data for basal-derived organoids with three technical replicates per timepoint. (d) Heatmap of metabolite abundance in primary basal-derived mouse organoids (n = 3 independent biological replicates per timepoint). (e) Fractional contribution from [U-13C]glucose to M2 and M3 citrate in basal-derived organoids (n = 3 independent biological replicates per timepoint). Error bars represent SEM. (f) Western blot analysis of proliferation marker PCNA in basal-derived organoids.

