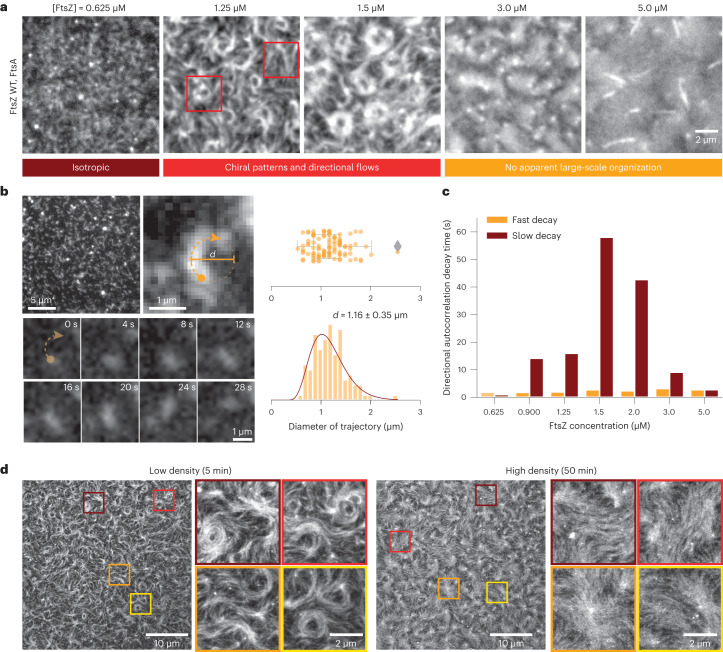
Fig. 1. FtsZ filament organization changes with increasing density on SLBs.
a, Representative TIRF micrographs of Alexa488-FtsZ at increasing FtsZ and constant FtsA concentrations. Below 0.625 µM FtsZ, filaments do not form higher-order structures. At 1.25 and 1.50 µM, FtsZ forms rotating rings and directionally moving filament bundles (see red squares). This organization is lost at concentrations above 3 µM FtsZ, at which filaments densely cover the membrane surface. The micrographs are representatives of at least four independent experiments (n = 4, 6, 8, 5 and 4 for [FtsZ] = 0.625, 1.25, 1.5, 3.0 and 5.0 µM, respectively). b, Representative images of a trajectory of a single FtsZ filament at 0.5 µM (left) and distributions of measured curvatures. The filament moves along a curved path, corresponding to an apparent diameter of 1.15 ± 0.35 µm (mean ± standard deviation, n = 105 trajectories from five independent experiments). c, Decay constants from fitting a biexponential function to directional autocorrelation curves from treadmilling trajectories. For intermediate concentrations, the best match is obtained by assuming a fast and slow decay constant (n = 4, 4, 6, 8, 4, 4 and 5 for [FtsZ] = 0.625, 0.900, 1.25, 1.50, 2.0, 3.0 and 5.0 µM, respectively; Extended Data Fig. 1d). d, Representative STED micrographs of 1.5 µM Atto633-FtsZ tethered to SLBs by 0.2 µM FtsA at low (5 min after starting the experiment (top)) and high (50 min (bottom)) densities. First, rotating rings and moving bundles coexisted on the membrane surface. With increasing filament density, the ring-like structures disappear.

