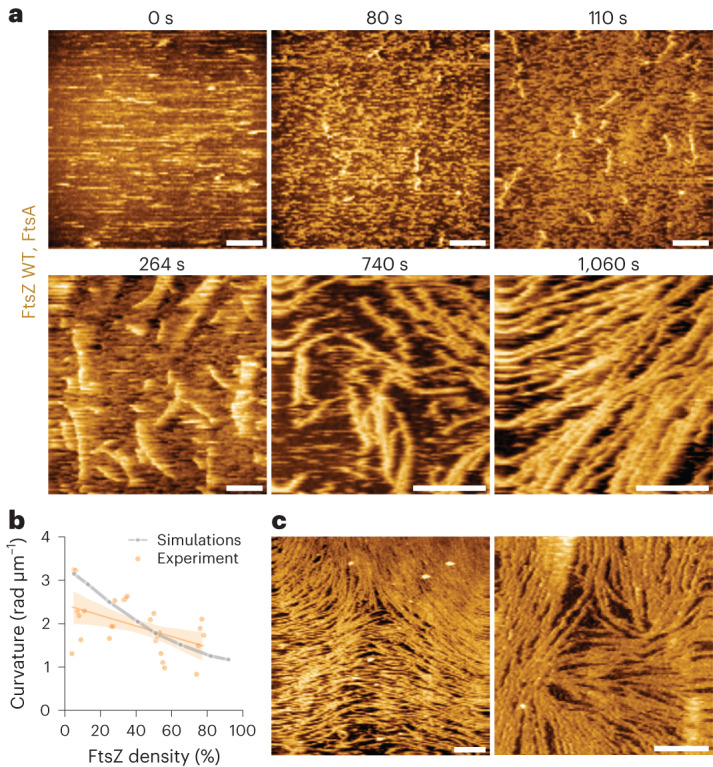
Fig. 4. HS-AFM imaging shows nematic organization at high densities of FtsZ filaments.

a, Representative HS-AFM time-lapse experiment, showing an increase in the density of FtsZ WT filaments with time. Scale bars, 500 nm. b, Curvature of FtsZ WT filaments at increasing densities from experiments (orange; mean ± standard deviation) and simulations (grey). With increasing densities, the curvature of individual filaments decreases. The curvature of FtsZ filaments was quantified from five independent experiments. The dots indicate the mean curvature of all the filaments at the indicated packing fraction. The thick lines represent the mean and the shaded area, the 95% confidence interval. c, At high densities, FtsZ WT filaments show nematic order with topological defects ([FtsZ] = 1.5 µM (left), 4.0 µM (right)). Scale bars, 500 nm.
