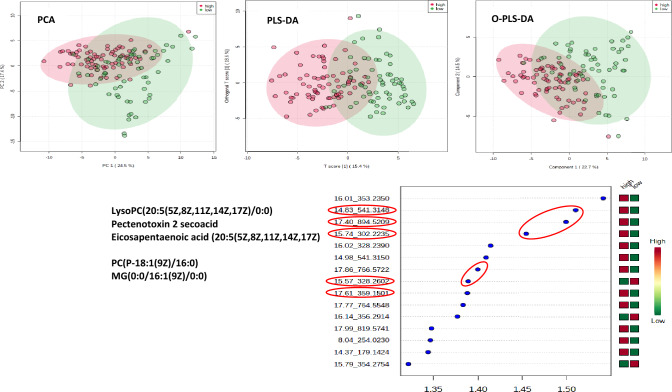
Fig. 1.
Multivariate statistical modelling of LC–MS data. Plots (top left, centre and right) shows group separations achieved by principal component analysis (PCA), orthogonal partial least squares discriminant analysis (OPLS-DA) and partial least squares discriminant analysis (PLS-DA), respectively. Red circles (1) represent patients with high MDS (5–10) and green circles (2) represent individuals with low MDS (0–4). Plot at the bottom is the resulting variable importance in projection (VIP) plot indicating the 15 most influential metabolites responsible for the observed separation in the PLS-DA model

