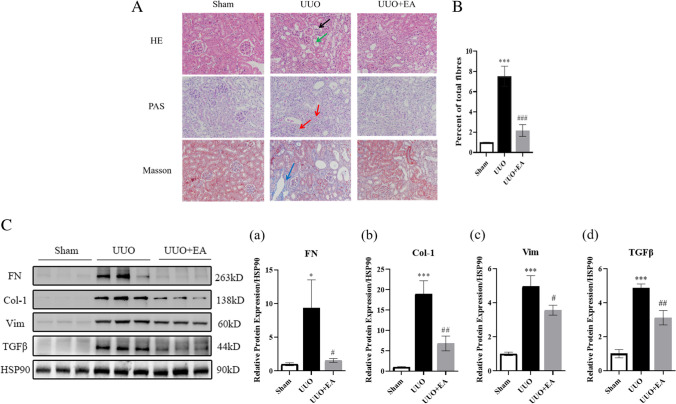
Figure 3.
Kidney pathology and ECM protein deposition in mice. (A) HE, PAS, and Masson staining of mice renal cortex (× 400),
 glomerular atrophy,
 renal tubular dilatation,
 thickening of renal tubular and glomerular basement membrane,
 collagen fiber deposition. (B) Quantification of collagen fibers of Masson stained in mouse renal cortex. (C) Expression of extracellular matrix protein in mice of each group and quantification of extracellular matrix protein like FN (a), collagen Ι (b), vimentin (c), and TGFβ (d). Values are the means ± SD. *p < 0.05, ***p < 0.001 vs. control group; #p < 0.05, ##p < 0.01, ### p < 0.001, vs. UUO group.

