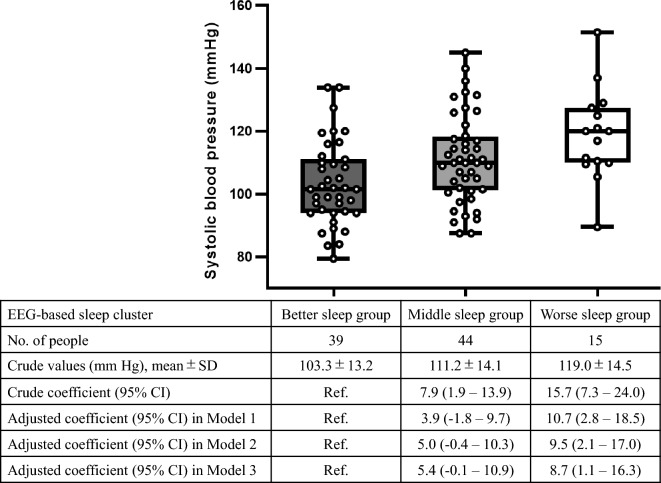
Figure 3.
Dot and box plots for systolic blood pressure by electroencephalogram-based sleep cluster and results of univariable and multivariable linear regression analyses. EEG electroencephalogram, CI confidence interval, SD standard deviation. Model 1 is adjusted for age and sex; Model 2 is further adjusted for body mass index, smoking history, and drinking habits; and Model 3 is further adjusted for the 3% oxygen desaturation index. In Model 3, two participants with missing values of 3% oxygen desaturation index are excluded. Each box plot shows the median, interquartile range, and minimum and maximum scores. Two patients receiving treatment for hypertension are excluded.

