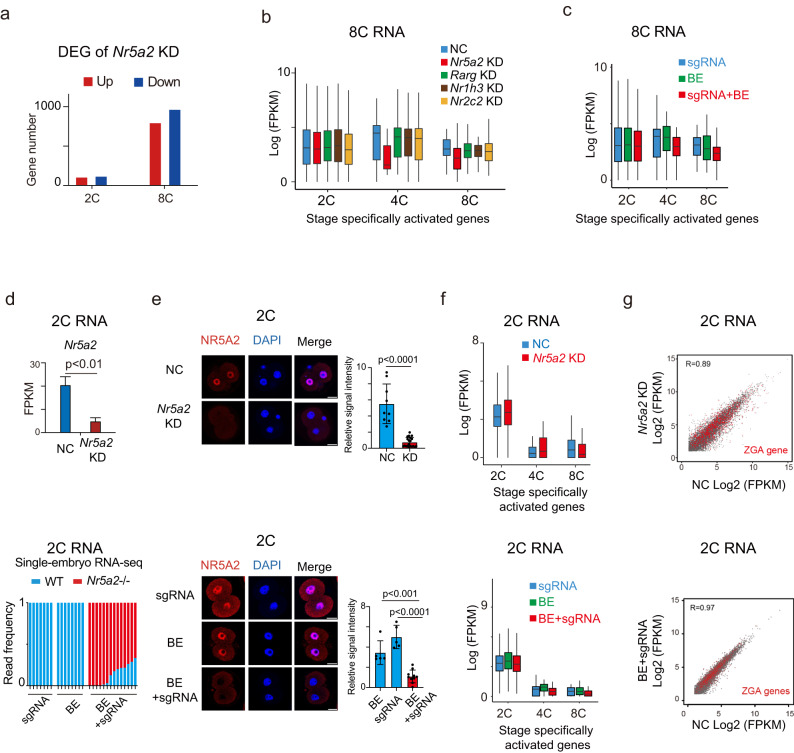
Fig. 2. NR5A2 is largely dispensable for global ZGA but is required for 4–8C gene activation.
a Bar plot showing the numbers of upregulated (red) and downregulated (blue) genes after Nr5a2 KD in mouse 2C and 8C embryos. b Box plots showing the average expression levels of stage-specifically activated genes for NC groups (blue), Nr5a2 KD groups (red), Rarg KD groups (green), Nr1h3 KD groups (brown), and Nr2c2 KD groups (yellow) at the 8C stage. c Box plots showing the average expression levels of stage-specifically activated genes after injection of sgRNA only (blue), BE mRNA only (green), and both sgRNA and BE mRNA (red) at the 8C stage. d Bar charts showing the expression of Nr5a2 in NC and Nr5a2 KD group at the 2C stage (left), with P values (t-test, two-sided) indicated (top). Bar charts show the percentages of WT Nr5a2 (blue) and base edited Nr5a2 (red) reads from RNA-seq after injection of Nr5a2 sgRNA only, BE mRNA only, and both sgRNA and BE mRNA at the 2C stage (bottom). e Immunofluorescence of NR5A2 (red) and DAPI (blue) in mouse 2C embryos after Nr5a2 KD (top, left). Immunofluorescence of NR5A2 (red) and DAPI (blue) in mouse 2C embryos after injection of sgRNA only, BE mRNA only, and both sgRNA and BE mRNA (bottom, left). Scale bars: 20 μm. Quantification of NR5A2 signal intensity (relative to DAPI) in mouse 2C (n = 4–7 embryos) and 8C (n = 6–8 embryos) embryos and P values (t-test, two-sided) are shown (right). Each dot represents a single blastomere. f Box plots showing the average expression levels of stage specifically activated genes for NC groups (blue) and Nr5a2 KD groups (red) at the 2C stage (top). Box plots show the average expression levels of stage-specifically activated genes after injection of sgRNA only (blue), BE mRNA only (green), and both sgRNA and BE mRNA (red) at the 2C stage (bottom). g Scatter plot comparing gene expression of NC group and Nr5a2 KD group in mouse 2C embryos (top). Scatter plot comparing gene expression of NC group and Nr5a2 base edited group in mouse 2C embryos (bottom). ZGA genes are colored in red. The Pearson correlation coefficients are also shown.

