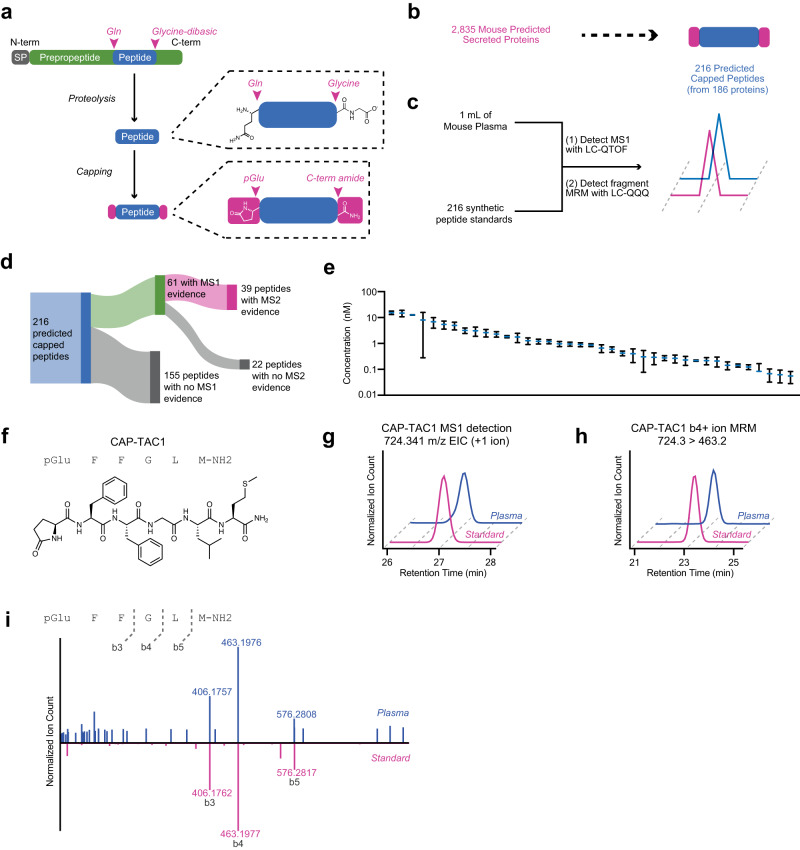
Fig. 1. Genomic prediction and mass spectrometry detection of capped peptides in mouse plasma.
a Schematic representation of capped peptide production from secreted, full-length preproprecursor proteins. N-term, N-terminal; C-term, C-terminal; SP, signal peptide; Gln, glutamine; pGlu, pyroglutamyl. b, c Number of predicted mouse capped peptides (b) and the targeted mass spectrometry strategy for their detection (c). d Schematic representation of proportion of capped peptides with MS1 parent ion evidence (LC-QTOF) and parent-to-daughter transition (LC-QQQ) evidence. e Concentration distributions of detected capped. f Chemical structure of CAP-TAC1 (pGlu-FFGLM-NH2). g–i Representative extracted ion chromatogram of the parent +1 ion at m/z = 724.341 (20 ppm) (g) and the MRM 724.3 to 463.2 b4+ ion transition (h), and MS/MS mirror plot i of authentic CAP-TAC1 standard (pink) and the endogenous mouse plasma peak (blue). e Data are shown as means ± SEM of N = 3 biologically independent pooled mouse plasma samples. g Experiment was repeated three times; for h, i, experiment was completed once. Source data are provided as a Source Data file.

