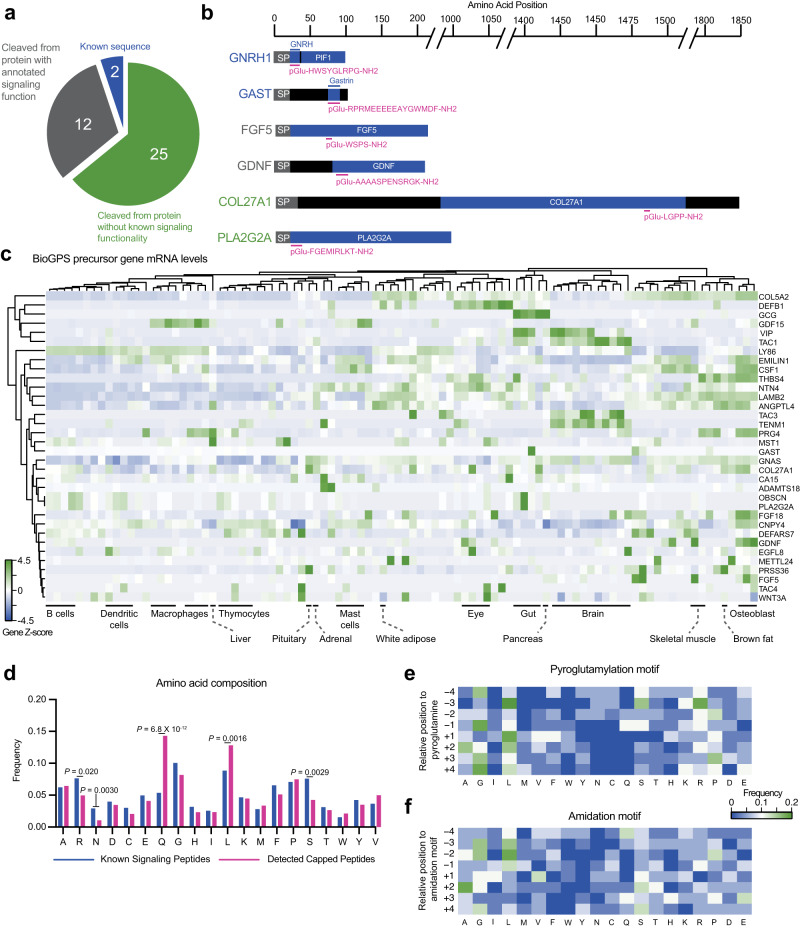
Fig. 2. Sequence and and gene-level analysis of capped peptides.
a, b Pie chart (a) and representative examples (b) of the distribution of mouse capped peptides based on their full-length preproprotein precursors. SP, signal peptide. c H-clustered heatmap of mRNA expression for capped peptide preproprecursor home genes across mouse tissues and cell types. d Frequency of each amino acid in capped peptides versus a Uniprot reference set of known peptide hormones and neuropeptides. e, f Heatmap of amino acid frequency within four residues upstream and downstream of the N-terminal pyroglutamylation (e) or C-terminal amidation (f). c Data were obtained from BioGPS and shown as Z score of the log-transformed value. d Data are presented as mean of frequency, and p values of known peptide hormones versus capped peptides is calculated by two-sided Student’s t test. Source data are provided as a Source Data file.

