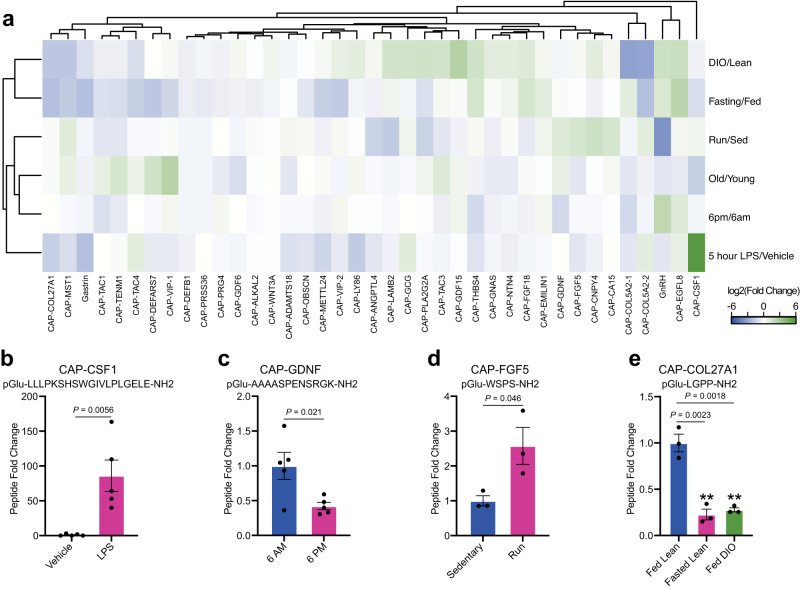
Fig. 3. Dynamic regulation of circulating capped peptide levels by different environmental and physiologic perturbations.
a Heatmap of the relative fold change for the indicated capped peptide in the indicated condition. b–e Representative peptide quantification for the indicated capped peptide in the indicated comparison. a, b “Fasting/Fed” indicates a comparison between plasma from 3-month old male mice on chow diet versus age- and sex-matched controls after fasting for 16 h (N = 3 biologically independent samples of pooled mouse plasma/group); “HFD/Chow” indicates a comparison between plasma from 4-month old male mice on chow diet versus 4-month old male mice after being on high-fat diet (HFD, 60% kcal from fat) for 9 weeks (N = 3 biologically independent samples of pooled mouse plasma/group); “LPS” indicates a comparison between plasma from 2-month old male mice following treatment with vehicle versus LPS (0.5 mg/kg, IP, 5 h, biologically independent samples of pooled mouse plasma/group); “6AM/6PM” indicates a comparison between plasma from 2-month old male mice at the beginning of the night cycle (6AM) versus age- and sex-matched mice at the beginning of the day cycle (6PM) (N = 5/group); “Old/Young” indicates a comparison between plasma from 4-month old male mice versus 23-month old male mice (N = 2 biologically independent samples of pooled mouse plasma/group); “Run/Sed” indicates a comparison between plasma from sedentary 3-month old male mice versus age- and sex-matched controls after an acute exhaustive 60 min run on a treadmill. b–e Data are shown as means ± SEM. P values versus control were calculated by two-sided Student’s t test. Source data are provided as a Source Data file.

