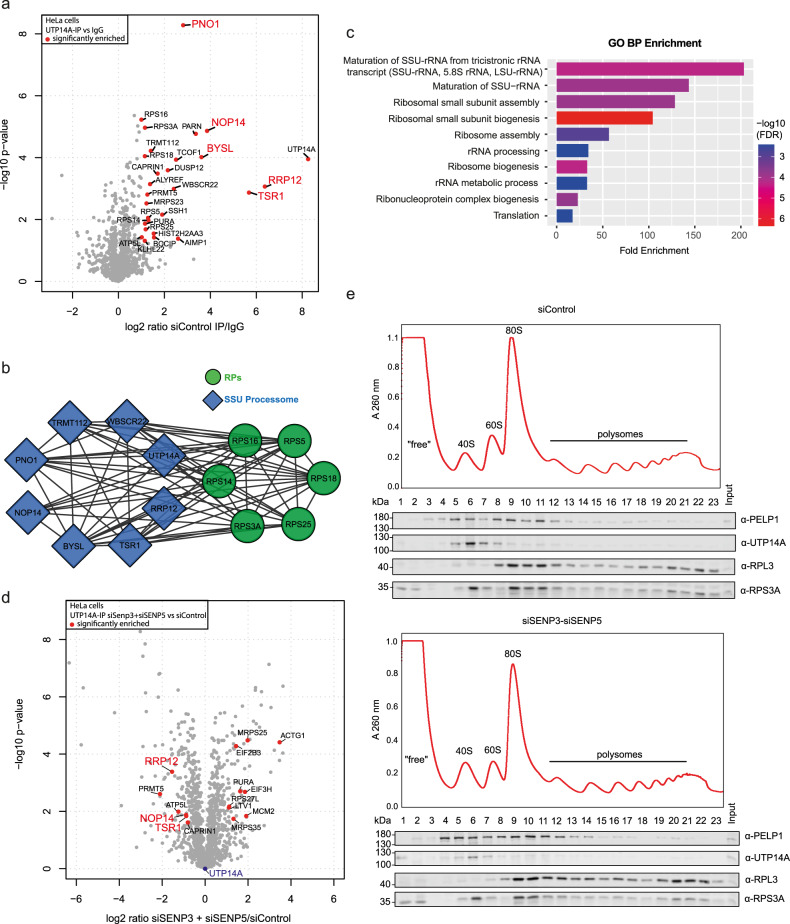
Fig. 3. SENP3 and SENP5 deficiency affects the UTP14A interactome and its pre-40S association.
a Volcano plot of UTP14A interactors identified by quantitative MS. HeLa cells were transfected with control siRNA for 72 h and endogenous UTP14A or control IP was performed. Significantly enriched proteins are indicated by red dots (log2 ratio ≥ 1, –log10 p value ≥ 1.3). Two-sided Student’s t-test analysis was performed to identify UTP14A interactors by comparing LFQ intensities of UTP14A-IP with IgG control IPs. b Significantly enriched UTP14A interactors identified in (a) are represented as STRING networks. Only high confidence (minimum interaction score 0.7) connections are shown. rProteins are highlighted in green, components of the SSU processome are marked in blue. Only connected proteins are visualized. c GO BP analysis of identified UPT14A interactors (highlighted in a). An FDR cutoff of 0.05 was applied and only the top 10 enriched biological processes are shown here. The ShinyGO online tool was used for analysis. d UTP14A interactome upon 72 h of siSENP3 and siSENP5 KD visualized as volcano plot. Two-sided Student’s t-test was performed. Significantly upregulated hits (log2 ratio ≥ 1 in siSENP3/5 UTP14A-IP vs siSENP3/5 IgG IP and log2 ratio ≥ 0.58 in siSENP3/5 UTP14A-IP vs siControl UTP14A-IP) and significantly downregulated hits (log2 ratio ≥ 1 in siControl UTP14A-IP vs siControl IgG IP and log2 ratio ≤ −0.58 in siSENP3/5 UTP14A-IP vs siControl UTP14A-IP) are highlighted in red. e Lysates of cycloheximide-treated HEK293T cells depleted of SENP3/5 or transfected with control siRNA were subjected to sucrose gradient density centrifugation. Top: respective absorbance profiles at 260 nm. Bottom: immunoblots to monitor the presence of indicated proteins in each fraction. Experiments were performed with three replicates. Source data for (e) are provided as a Source Data file.

