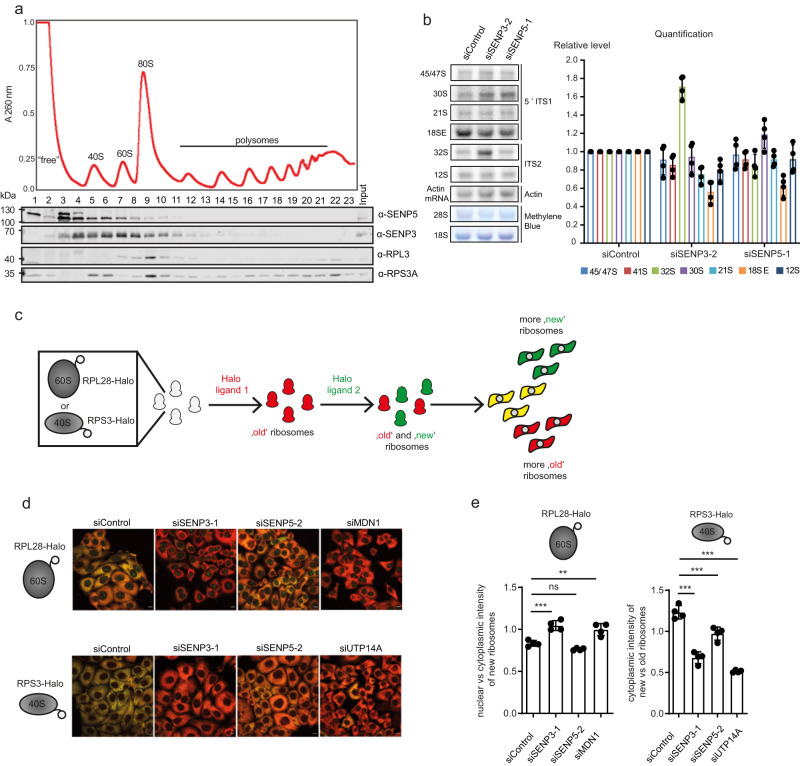
Fig. 4. SENP3 and SENP5 deficiency leads to defects in ribosome maturation.
a Whole-cell lysates from cycloheximide-treated HEK293T cells were separated using sucrose density centrifugation. Peaks corresponding to (pre-)ribosomal complexes are marked on an absorbance profile at 260 nm (top). The presence of the indicated proteins in each fraction of the gradient was determined by western blotting. Experiments were performed with two replicates. b Total RNAs extracted from siRNA-treated cells were separated by denaturing agarose gel electrophoresis and transferred to nylon membrane. 28S and 18S rRNAs were detected by methylene blue staining. Pre-rRNA species were detected using [32P]-labeled probe hybridizing in the internal transcribed spacers 1 (5’ ITS1) and 2 (ITS2). The actin mRNA served as a loading control. The levels of major pre-rRNA species were quantified in four experiments and are shown as mean ± standard deviation. Statistical significance was determined using the two-tailed Student’s t-test. c Simplified workflow of the Ribo-Halo assay used to monitor the cellular production of either 60S or 40S ribosomal subunits. RPL28 or RPS3 were endogenously tagged with the HaloTag, using the CRISPR/Cas system. Afterward, cells were treated with two different Halo ligands (R110-ligand, TMR ligand) to finally follow the production and export of both ribosomal subunits with fluorescence microscopy. d Representative fluorescent images of HeLa RPL28-Halo (top) and RPS3-Halo (bottom) cells transfected as indicated and stained with Halo ligands as shown in (c). “Old” 60S ribosomal subunits are shown in red, “new” 60S ribosomal subunits are shown in green. Scale bar = 10 µm. e Quantification of Ribo-Halo experiments exemplified in (d). The nuclear vs cytoplasmic intensity of newly synthesized ribosomes (left) or the cytoplasmic intensity of new vs old ribosomes in the cytoplasm (right) was determined. Two-sided t-testing was performed for statistical analysis. Experiments were performed with four replicates and the data are shown as mean ± standard deviation. Source data for (a), (b), and (e) are provided as a Source Data file.

