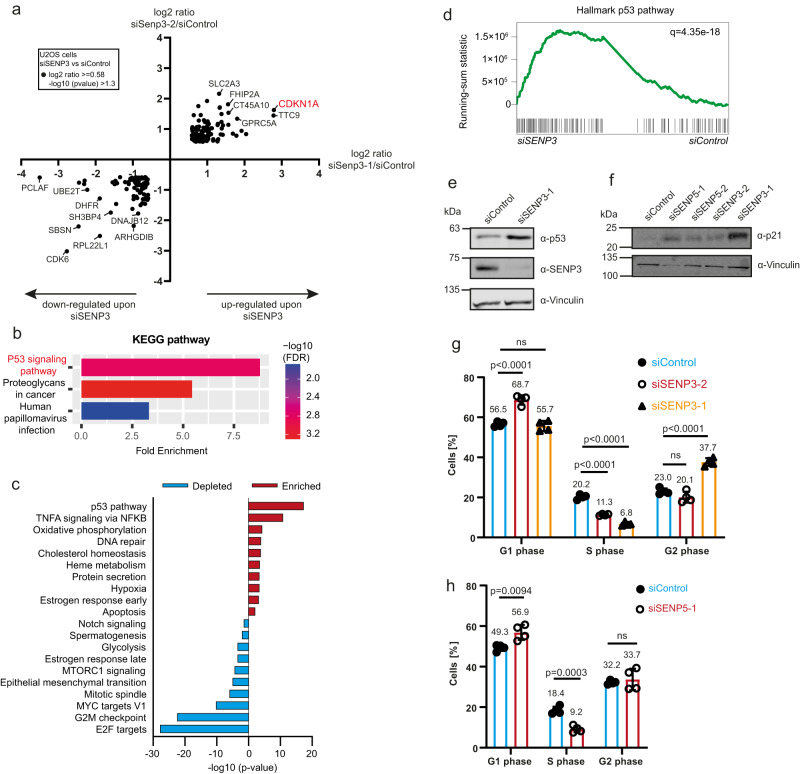
Fig. 5. SENP3 and SENP5 deficiency triggers the canonical p53-dependent impaired ribosome biogenesis checkpoint.
a Whole-cell proteome of U2OS cells transfected with siSENP3-1 (X-axis) or siSENP3-2 (Y-axis) compared to control siRNA transfection. Results of the TMT-based MS analysis are visualized in a XY diagram, comparing either of the two SENP3 siRNAs against the control. Only significant hits that are regulated in the same way with both siRNAs are displayed (log2 ratio ≥ 0.58; –log10 p value was ≥1.3). The identification of those candidates was based on two-sided Student’s t-test analysis comparing the normalized TMT abundances of siSENP3 with siControl. Experiments were performed with four replicates. b KEGG pathway enrichment analysis of regulated proteins identified in (a) (log2 ratio ≥ 1, –log10 p value ≥ 1.3). Analysis was done using the ShinyGO tool, applying an FDR cutoff of 0.05 (c) top 10 analysis (d) Gene Set Enrichment Analysis (GSEA) of Hallmark analysis of RNA-Seq analysis performed in U2OS WT cell transfected for 72 h with two different siRNAs against SENP3 or control siRNA. Enriched terms upon SENP3 KD are shown in red, depleted terms are colored in blue. e U2OS cells were transfected with siSENP3 or siControl 72 h prior to cell lysis. Lysates were immunoblotted as indicated. f U2OS cells were depleted for SENP3 or SENP5 with two independent siRNAs for 72 h and subsequently immunoblotted as indicated. g Cell cycle analysis of U2OS cells transfected with two different siRNAs against SENP3 (red and orange) or siControl (blue) for 72. PI staining was performed and the cell cycle profile was analyzed with flow cytometry. Subsequently, the percentage of cells in G1, S or G2 phase was determined. Significance level was calculated by two-sided t-tests. Experiments were performed with four replicates and are shown as mean ± standard deviation. Mean values of the percentages are shown above the bars. h PI staining of U2OS cells transfected with siSENP5 (red) or siControl (blue) for 72 h. Cell cycle profile was analyzed by flow cytometry and the percentages of cells in either G1, S or G2 phase were determined. Significance level was calculated by two-sided t-tests. Experiments were performed with four replicates and are shown as mean ± standard deviation. Mean values of the percentages are shown above the bars. Source data for (e)–(h) are provided as a Source Data file.

