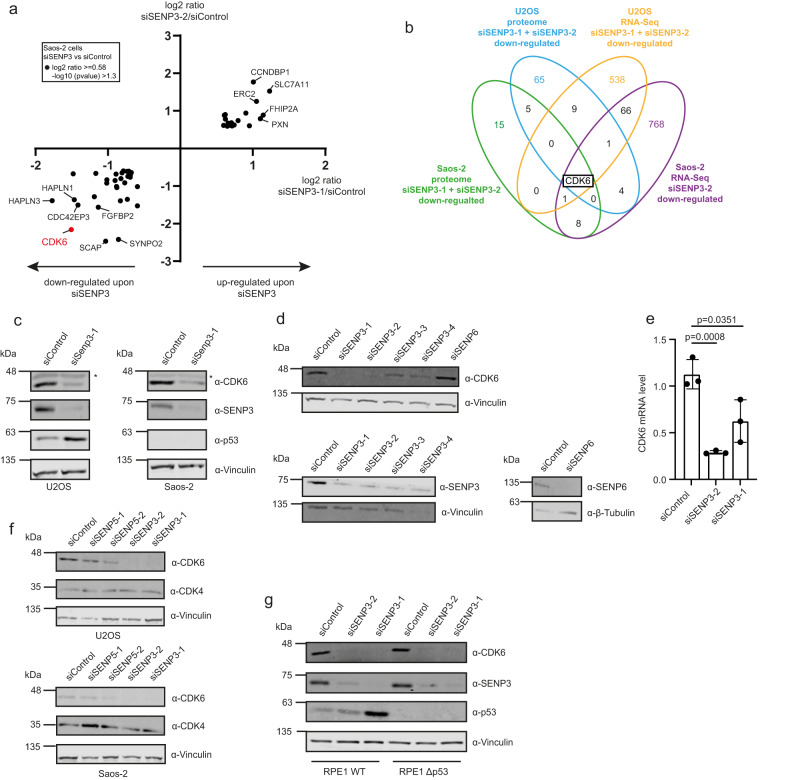
Fig. 6. SENP3 and SENP5 deficiency induces downregulation of CDK6.
a Whole-cell proteome of SAOS-2 cells transfected with siSENP3-1 (X-axis) or siSENP3-2 (Y-axis) compared to control siRNA transfection. Results of the TMT-based MS analysis are visualized in a XY diagram, comparing either of the two SENP3 siRNAs against the control. Hits were considered as significantly enriched, if the log2 ratio was ≥0.58 and the –log10 p value was ≥1.3. Only significant hits, that are regulated in the same way with both siRNAs are displayed. The identification of those candidates was based on two-sided Student’s t-test analysis comparing the normalized TMT abundances of siSENP3 with siControl. CDK6 is highlighted in red. Experiments were performed with four replicates for siControl and siSENP3-2 and in triplicates for siSENP3-1. b Venn diagram showing the overlap of proteins, that were downregulated upon SENP3 knockdown in whole-cell proteome analysis of SAOS-2 and U2OS cells (Fig. 5) using two different SENP3 siRNAs (log2 ratio ≥ 0.58, –log10 p value ≥ 1.3). Furthermore, proteins identified as downregulated on mRNA level in transcriptomic analysis of U2OS cells or SAOS-2 cells, transfected with siSENP3-2, were considered. c U2OS (left panel) or SAOS-2 cell (right panel) were transfected with control siRNA or siRNA against SENP3. After 72 h, cells were lysed and proteins were analyzed by immunoblotting as indicated. d KD of SENP3 using four independent siRNAs, SENP6 KD or control KD were performed in U2OS cells. 72 h after transfection cell lysates were analyzed by immunoblotting as indicated. e SENP3 was depleted from U2OS cells by two different siRNAs. 72 h after transfection cells were lysed, total RNA was isolated and reverse transcribed into cDNA. By qPCR analysis the CDK6 mRNA level was determined. Three independent experiments were performed and are shown as mean ± standard deviation. Two-sided t-tests were performed. f U2OS (left panel) or SAOS-2 cells (right panel) were transfected with control siRNA or two independent siRNAs against SENP3 or SENP5. After 72 h, cells were lysed and proteins were analyzed by immunoblotting as indicated. g Parental RPE1 or RPE1Δp53 cells were transfected with two different SENP3 siRNAs or siControl for 72 h. Subsequently, cells were lysed and the protein level of CDK6, SENP3, p53 and Vinculin was analyzed by immunoblotting. Source data for (c)–(g) are provided as a Source Data file.

